Figures & data
Figure 1 Exemplary light microscopic images of transfected and differentiated 3T3-L1 cells at d6 of differentiation after ORO-staining. The staining intensities of in lipid droplets accumulated ORO are presented including different sample conditions: N-TER peptide–nucleic acid complexes containing NTC or miRNA-27a (A) and the control groups comprising free NTC, miRNA-27a, N-TER peptide as well as cells only (B). Cells only serve as a control to assess the impact of the transfection treatment on adipocyte differentiation.
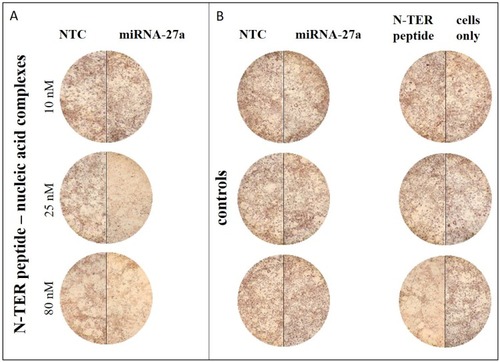
Figure 2 Semi-quantitative absorbance measurements of in lipid droplets accumulated ORO at d6 of differentiation. The degree of lipid accumulation in triple transfected and differentiated cells is evaluated according to N-TER peptide–nucleic acid complexes (A) and controls (B) comprising free NTC, miRNA-27a, N-TER peptide as well as cells only. Cells only serve as a control to assess the impact of the transfection treatment on adipocyte differentiation. All results are presented as mean±SD (n=6). Statistical significance is marked as *(p<0.05) and ***(p<0.001).
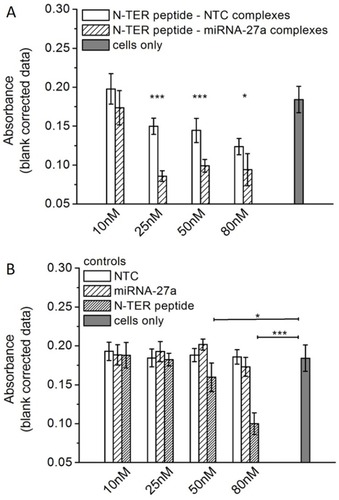
Figure 3 N-TER peptide–FluoNTC complexes (blue colored) at high (100 nM, image A, above) and low (5 nM, image B, below) nucleic acid concentrations on formaldehyde-fixated 3T3-L1 preadipocytes. Topography and cellular adhesion of the complexes are visualized by using a triple combination of AFM, BF and fluorescence microscopy at the same sample area. Heights of the particles/agglomerates are estimated by using particle size profiles (marked as 1 and 2; for further information about the respective particle size profiles, see supplementary materials Figure S1).
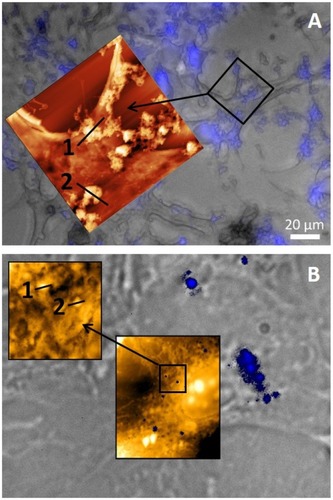
Figure 4 Fluorescence microscopic images of 3T3-L1 cells at 37°C transfected with N-TER peptide–FluoNTC complexes (red) at 10 nM or 100 nM (4-hr post-transfection) and at 5 nM or 50 nM (24-hr and 48-hr post-transfection). Cells only represent the non-transfected cells. Hoechst 33342 (blue) and Alexa Fluor 488 Phalloidin (green) are used to stain cell nuclei and cytoskeleton, respectively.
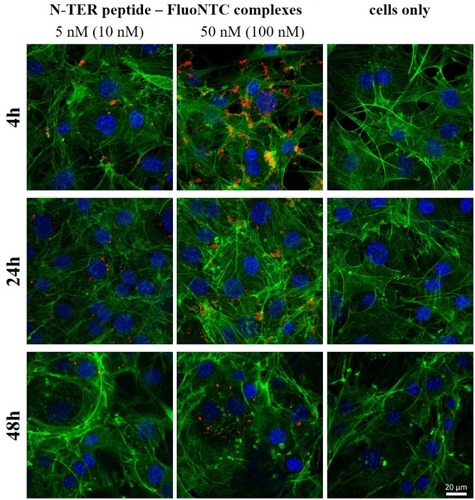
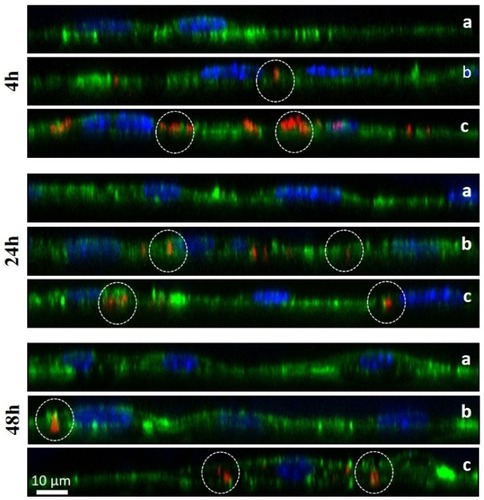
Figure 5 Fluorescence microscopic z-stacks of 3T3-L1 cells at 37°C. The panels show non-treated cells (panel a) or cells transfected with N-TER peptide–FluoNTC complexes (red). Panel b represents the low nucleic acid concentrations (5 nM) whereas panel c represents the high nucleic acid concentrations (50 nM). Hoechst 33342 (blue) and Alexa Fluor 488 Phalloidin (green) are used to stain cell nuclei and cytoskeleton, respectively. The dashed circles exemplarily indicate adhesion/uptake of fluorescent-labelled NTC according to the particular incubation period (4 hrs, 24 hrs, 48 hrs).