
Figures & data
Table 1 The physicochemical characteristics of OA-NLC in the absence or presence of albumin
Figure 1 Transmission electron micrograph images of OA-NLC.
Notes: OA–NLC was applied to a copper grid coated with formvar/carbon film, and then stained with 1% phosphotungstic acid. The sample was subsequently dried in the air prior to observation under TEM. Scale bar, 200 nm. Representative data from four independent experiments are shown.
Abbreviations: OA-NLC, oleic acid within nanostructured lipid carriers; TEM, transmission electron microscopy.
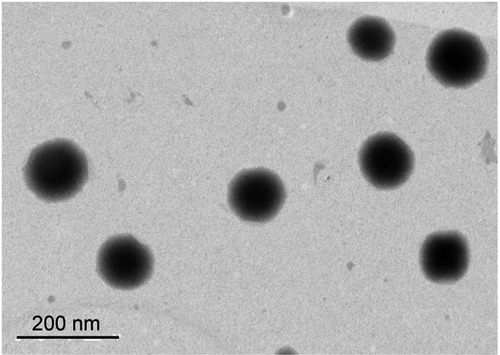
Figure 2 OA and OA-NLC do not have cytotoxicity effect.
Notes: Neutrophils (6×10⁵ cells/mL) were treated with various concentrations of OA (A, C) or OA-NLC (B, D) for 17 min in the absence (A, B) or presence (C, D) of 0.1% BSA. LDH activity was assessed with a commercial LDH assay kit. Measured colorimetric signal was presented as a percentage of total LDH activity, as determined by measuring the fluorescence of lysed neutrophils treated with 0.1% Triton X-100. Data are expressed as mean standard error of the mean, n=4.
Abbreviations: OA, oleic acid; OA-NLC, oleic acid within nanostructured lipid carriers; BSA, bovine serum albumin; LDH, lactate dehydrogenase.
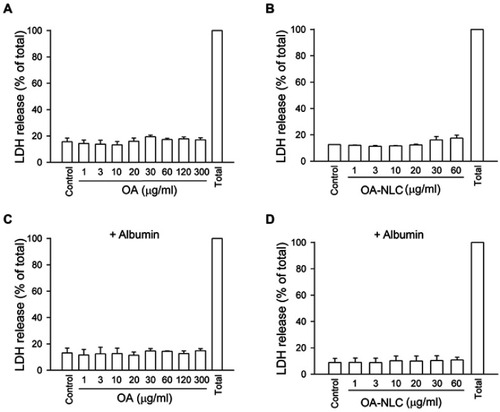
Figure 3 Effects of OA and OA-NLC on superoxide generation in activated neutrophils.
Notes: Human neutrophils (6×10⁵ cells/mL) were pre-incubated with OA or OA-NLC and then activated with cytochalasin B (1 μg/mL) and fMLF (0.1 μM) in the absence or presence of 0.1% BSA. (A, B) In the absence of BSA, superoxide release was reduced by both OA and OA-NLC. (C, D) In the presence of BSA, only OA-NLC inhibited superoxide release. Superoxide generation was detected spectrophotometrically using ferricytochrome c. Data are expressed as the mean ± standard error of the mean, n=6, **P<0.01, ***P<0.001, as compared to the control assay.
Abbreviations: OA, oleic acid; OA-NLC, oleic acid within nanostructured lipid carriers; BSA, bovine serum albumin.
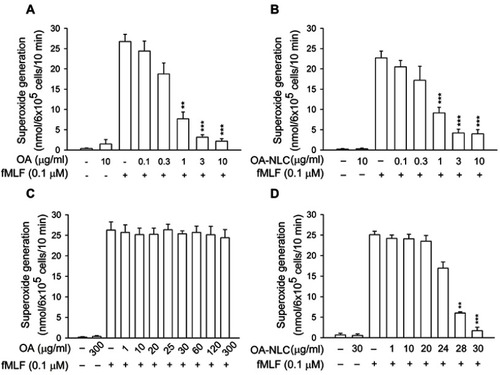
Figure 4 Effects of OA and OA-NLC on elastase release in fMLF-activated neutrophils.
Notes: Human neutrophils (6×10⁵ cells/mL) were pre-incubated with OA or OA-NLC and then activated with cytochalasin B (0.5 μg/mL) and fMLF (0.1 μM) in the absence or presence of 0.1% BSA. (A, B) In the absence of BSA, elastase release was reduced by both OA and OA-NLC. (C, D) In the presence of BSA, only OA-NLC inhibited elastase release. Elastase release was detected spectrophotometrically using elastase substrate. Data are expressed as the mean ± standard error of the mean, n=6, **P<0.01, ***P<0.001, as compared to the control assay.
Abbreviations: OA, oleic acid; OA-NLC, oleic acid within nanostructured lipid carriers; BSA, bovine serum albumin.
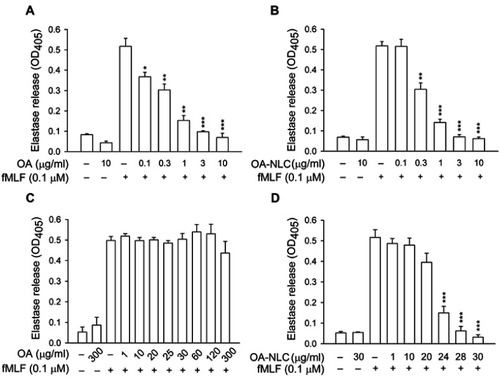
Figure 5 Effects of OA and OA-NLC on elastase release in LTB4-activated neutrophils.
Notes: Human neutrophils (6×10⁵ cells/mL) were pre-incubated with OA or OA-NLC and then activated with cytochalasin B (0.5 μg/mL) and LTB4 (0.1 μM) in the absence or presence of 0.1% BSA. (A, B) In the absence of BSA, elastase release was reduced by both OA and OA-NLC. (C, D) In the presence of BSA, only OA-NLC inhibited elastase release. Elastase release was detected spectrophotometrically using elastase substrate. Data are expressed as the mean ± standard error of the mean, n=6, **P<0.01, ***P<0.001, as compared to the control assay.
Abbreviations: OA, oleic acid; OA-NLC, oleic acid within nanostructured lipid carriers; BSA, bovine serum albumin.
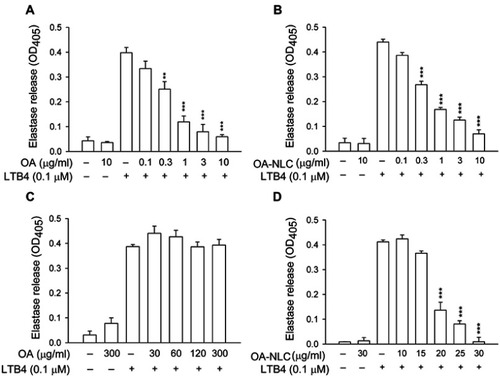
Table 2 Effects of OA and OA-NLC on Ca2+ mobilization in the absence or presence of albumin
Figure 6 Effects of OA and OA-NLC on Ca2+ mobilization.
Notes: Fluo 3-loaded neutrophils were incubated with OA or OA-NLC for 5 min. Cells were then activated by fMLF (0.1 μM). Mobilization of Ca2+ was determined in real time in a spectrofluorometer. (A, B) In the absence of BSA, neither OA nor OA-NLC affected peak [Ca2+]i values in fMLF-activated neutrophils; however, they significantly decreased the time required for [Ca2+]i to return to half of the peak value (t1/2). (C, D) In the presence of BSA, OA-NLC, but not OA, affected t1/2 values. Representative traces from four independent experiments are shown.
Abbreviations: OA, oleic acid; OA-NLC, oleic acid within nanostructured lipid carriers; BSA, bovine serum albumin.
![Figure 6 Effects of OA and OA-NLC on Ca2+ mobilization.Notes: Fluo 3-loaded neutrophils were incubated with OA or OA-NLC for 5 min. Cells were then activated by fMLF (0.1 μM). Mobilization of Ca2+ was determined in real time in a spectrofluorometer. (A, B) In the absence of BSA, neither OA nor OA-NLC affected peak [Ca2+]i values in fMLF-activated neutrophils; however, they significantly decreased the time required for [Ca2+]i to return to half of the peak value (t1/2). (C, D) In the presence of BSA, OA-NLC, but not OA, affected t1/2 values. Representative traces from four independent experiments are shown.Abbreviations: OA, oleic acid; OA-NLC, oleic acid within nanostructured lipid carriers; BSA, bovine serum albumin.](/cms/asset/63409822-82d0-4d4f-85bd-09d187c203a7/dijn_a_12190972_f0006_c.jpg)
Figure 7 NLC uptakes by neutrophils.
Notes: Neutrophils (1.8×10⁷ cells/mL were co-incubated with (A) rhodamine 800 labeled-OA-NLC, and (B) H20 layer of rhodamine 800-loaded OA-NLC after configuration, at 37 °C for 5 min. The intracellular fluorescence signal was then observed by CLSM. (A) Fluorescence signals were observed throughout the neutrophil cytoplasm. Scale bar, 20 μm.
Abbreviations: CLSM, confocal laser scanning microscopy; NLC, nanostructured lipid carriers; OA-NLC, oleic acid within nanostructured lipid carriers.
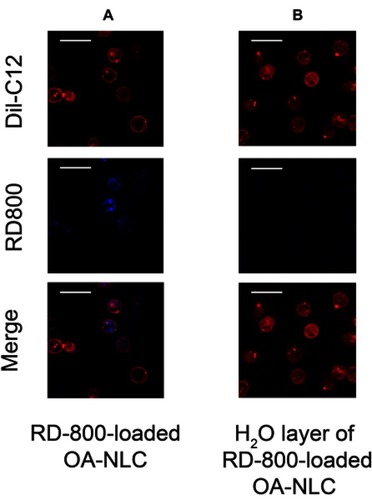
Figure 8 TEM images of NLC interaction with albumin.
Notes: OA-NLC was co-incubated with or without BSA (5%), subsequently applied to a 200-mesh copper grid coated with formvar/carbon film. The sample was then stained with 1% phosphotungstic acid and observed under TEM. The diameter of the NLC-albumin complex with a protein corona (arrow) is larger than that of the NLC without a protein corona ().
Abbreviations: NLC, nanostructured lipid carriers; OA-NLC, oleic acid within nanostructured lipid carriers; BSA, bovine serum albumin; TEM, transmission electron microscopy.
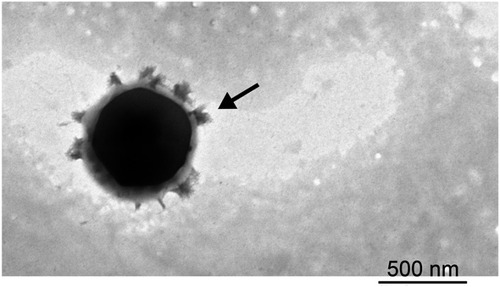
Figure 9 Effects of OA and OA-NLC on LTB4-induced skin inflammation.
Notes: OA or OA-NLC were applied topically to ear of the mice, followed by the topical application of LTB4 (0.5 μg/mL, in ethanol). Skin inflammation was characterized by epidermal neutrophil infiltration, which was alleviated by OA and OA-NLC. Representative histology images from six independent experiments are shown. Magnification, 400×; inset, 800×, Scale bar represent 50 μm; 25 μm (A) sham-operated mice. (B) Mice with LTB4-induced skin inflammation. (C) Mice with LTB4-induced skin inflammation pretreated with OA. (D) Mice with LTB4-induced skin inflammation pretreated with OA-NLC. (E) Administration of OA and OA-NLC suppress MPO activity, which had a significantly increased in inflamed skin induced with LTB4. Data are expressed as the mean ± standard error of the mean, n=6, **P<0.01, ***P<0.001, as compared to the control assay.
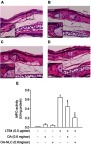
Table S1 Effects of unsaturated fatty acids on superoxide generation and elastase release