Figures & data
Table 1 Particle size polydispersity index and zeta potential for drug-loaded and free solid lipid nanoparticles in colloidal suspension
Figure 1 Zeta potential of (A) drug-loaded solid lipid nanoparticles and (B) free solid lipid nanoparticles.
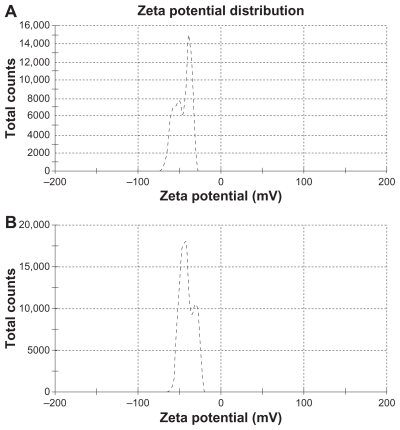
Figure 2 Scanning electron micrographs of freshly prepared solid lipid nanoparticles loaded with triamcinolone acetonide; (A) 3.00 K× resolution, (B and C) 20.00 K× resolution.
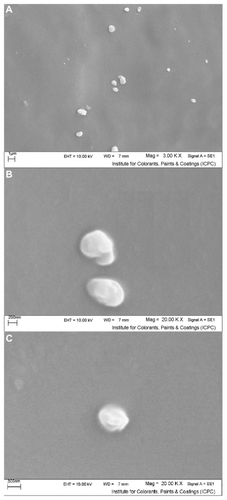
Figure 3 Atomic force microscopy of solid lipid nanoparticles loaded with triamcinolone acetonide. (A) and (B) are solid lipid nanoparticles loaded with triamcinolone acetonide after 24 hours. (C) and (D) are solid lipid nanoparticles loaded with triamcinolone acetonide after 48 hours remaining on a mica slide. (E) and (F) are solid lipid nanoparticles loaded with triamcinolone acetonide after 1 week remaining on a mica slide. A, C, and D are three-dimensional images of the multiparticles and B, D, and F are the two-dimensional pictures of the multiparticles.
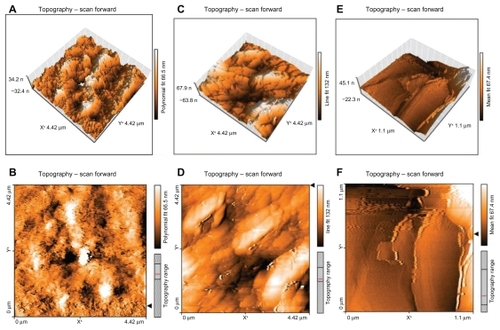
Figure 4 Differential scanning calorimetry thermograms of (A) tripalmitin glyceride, (B) a physical mixture of tripalmitin glyceride, triamcinolone acetonide, and modified phosphatidylethanolamine, (C) lyophilized solid lipid nanoparticle suspension, (D) sucrose, and (E) triamcinolone acetonide.
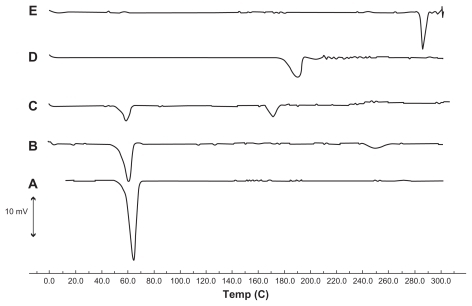
Figure 5 Drug release from nanoparticles after 60 hours in four different types of medium, each value represents the mean of three experiments ± standard deviation.
Abbreviation: TA, triamcinolone acetonide.
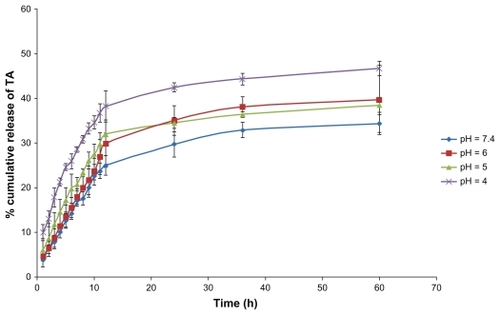
Table 2 R2 and K for drug-release experiment in four types of receptor medium
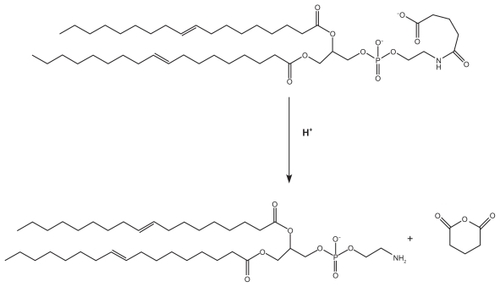
Figure 6 Terminal release of anhydride from modified phosphatidylethanolamine.