Figures & data
Figure 1 Overview of general promoters and reducers of reactive oxygen species (ROS). ROS are products of cellular respiration and their formation can contribute to oxidative stress and conditions, such as carcinogenesis, inflammation and aging. Upon elevated levels of ROS, cells may protect themselves by activating ROS reducing enzymatic or non-enzymatic mechanisms. Some factors that contribute to increasing or decreasing the ROS level are listed in the figure.
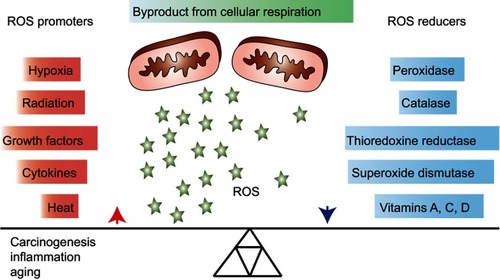
Figure 2 Size distribution of NPs and degradation of NPs in the presence of H2O2. The size distributions (hydrodynamic diameter, intensity weighted) for empty or AlexaFluor polymers conjugated P1 NPs (A), empty or AlexaFluor conjugated polymers P2 NPs (B) and PTX encapsulated P1 and P2 NPs (C) are shown. The average values of the hydrodynamic diameter (DH) and the polydispersity index (PDI) are also indicated. The SD values obtained (n=10) were smaller than the symbols used in the figure and therefore not visible. SEC chromatograms of P1 NPs (D) and P2 NPs (E) prior to the addition of H2O2 (black lines) and after degradation for 1 day (D) and 3 days (E) in 20% PBS/DMF solutions at 37°C containing 500 (red lines), 1 (green line) or 5 mM (blue lines) H2O2.
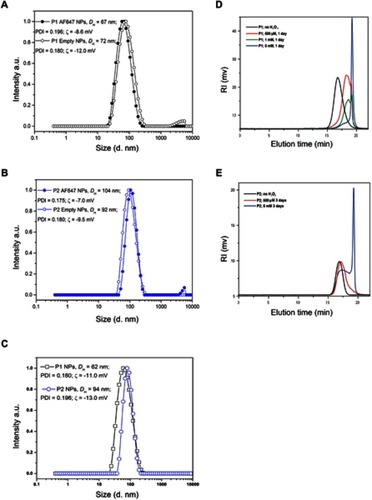
Table 1 The average values of hydrodynamic diameter (DH), polydispersity index (PDI) and zeta-potential (ζ) of empty, AlexaFluor 647 (AF647) conjugated, NR-loaded, and PTX encapsulated polymers P1 and P2 NPs are listed
Figure 3 Flow cytometry and confocal microscopy images. Histograms show NR total fluorescence after 0 hr post-chasing (light blue/light green) and NR quenching in PC-3 cells 4 hrs post-chasing (dark blue/dark green) with P1 NPs (A; top panel) and P2 NPs (A; bottom panel). Grey curves indicate cells without fluorescence. Mean total NR fluorescence in PC-3 cells after 2 hrs chase with NR-loaded NPs 0 and 4 hrs post-chase (B). Confocal images of PC-3 cells after incubation with NR-loaded P1 NPs (left panel) and P2 NPs (right panel) for 4 (C, D) or 20 hrs (E, F) post-chasing. Error bars show SD. Asterisk indicates statistical significance obtained by one-way ANOVA and Tukey’s multiple comparisons post-hoc test. *P<0.05 (n=3).
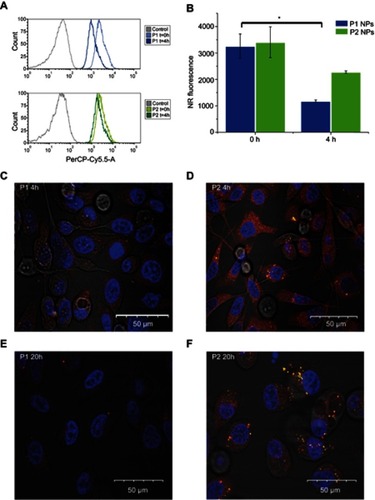
Figure 4 Treatment efficacy in mice bearing HeLa tumors. (A) The effect of the different treatments on HeLa tumors in mice was studied for 30 days. PTX containing P1 NPs, P2 NPs or nab-PTX were injected with 60 mg/kg PTX. Free PTX was injected twice (day 1 and 7); 15 mg/kg in each injection. The blue arrows indicate PTX injections. PBS was used as a control. Data are shown as mean±SEM (P1NPs: n=11; P2 NPs, nab-PTX and PTX: n=10). Statistical significance between the treatment groups was calculated using AUC of individual tumors. Error bars show SEM. Asterisks indicate statistical significance obtained by two-tailed unpaired t-test. *P<0.05, **P<0.005. (B) Relative tumor volume at day 18 after the treatment plotted before two treatment groups were discontinued due to very large tumors. Statistical significance was determined using two-tailed unpaired t-test. Error bars show SEM. Asterisks indicate level of significance of each data set (n=12 [PBS], n=11 [P1], n=10 [P2, nab-PTX, PTX]). *P<0.05, **P<0.005, ****P<0.0001.
![Figure 4 Treatment efficacy in mice bearing HeLa tumors. (A) The effect of the different treatments on HeLa tumors in mice was studied for 30 days. PTX containing P1 NPs, P2 NPs or nab-PTX were injected with 60 mg/kg PTX. Free PTX was injected twice (day 1 and 7); 15 mg/kg in each injection. The blue arrows indicate PTX injections. PBS was used as a control. Data are shown as mean±SEM (P1NPs: n=11; P2 NPs, nab-PTX and PTX: n=10). Statistical significance between the treatment groups was calculated using AUC of individual tumors. Error bars show SEM. Asterisks indicate statistical significance obtained by two-tailed unpaired t-test. *P<0.05, **P<0.005. (B) Relative tumor volume at day 18 after the treatment plotted before two treatment groups were discontinued due to very large tumors. Statistical significance was determined using two-tailed unpaired t-test. Error bars show SEM. Asterisks indicate level of significance of each data set (n=12 [PBS], n=11 [P1], n=10 [P2, nab-PTX, PTX]). *P<0.05, **P<0.005, ****P<0.0001.](/cms/asset/f694f4a1-3711-4288-a40f-925c9d3b4c51/dijn_a_12190981_f0004_c.jpg)
Figure 5 Biodistribution of P1 or P2 in healthy mice. In vivo fluorescence imaging of healthy mice at 1, 4 and 24 hrs after i.v. administration of unconjugated or AlexaFluor 647 (AF647) conjugated P1 or P2 NPs (A). Ex vivo fluorescence images of isolated organs, 24 hrs after injection (B). The columns demonstrate total radiant efficiency per pixel of region of interest of liver, lungs and spleen after 24 hrs (C). *SI=small intestine.
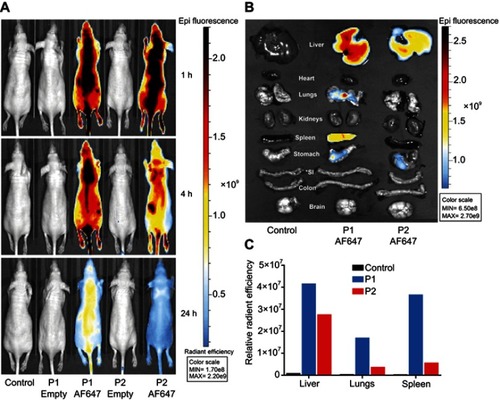
Figure 6 Expression of macrophage markers in untreated or treated HeLa tumor tissues. Macrophage infiltration was measured in HeLa tumors after treatment with PBS, P1 NPs, P2 NPs, nab-PTX or PTX. The total population of infiltrated macrophages was quantified using an antibody to CD68 (A). The population of pro-inflammatory (anti-tumorigenic) M1 macrophages was quantified using an antibody to iNOS (B). The population of anti-inflammatory (pro-tumorigenic) M2 macrophages was quantified with an antibody to CD206 (C). Data are shown as mean-stained pixel ratio±SEM (n=5 random regions in each tumor). Calculation of the stained pixel ratio is illustrated in . Asterisks indicate statistical significance obtained by two-tailed unpaired t-test. *P<0.05, **P<0.006.
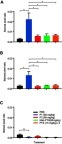
Figure S1 Structure of polymers. Polymers synthesized and utilized for the preparation of the PTX-loaded P1 NPs (A) and P2 NPs (B). (C) AlexaFluor 647 conjugated NPs (only showed for P1)
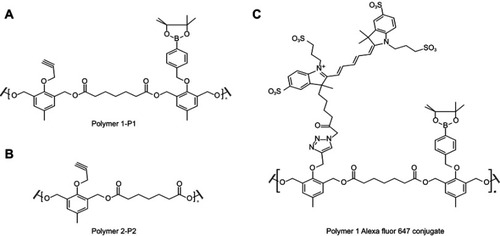
Figure S2 Calculation of myeloid cell infiltration in tumor tissue. The displayed photomicrograph slide was digitalized and randomly selected frames were imported to ImageJ software. Subsequently, black threshold was created over original frame and a binary mask was created to visualize black spots on white background (A). Quantification of shown example displays stained pixelated area, total pixelated area, pixel size and pixel count. The ratio of the stained area pixel to the total area pixel is called the stained pixel ratio and is shown on the y-axes in and (B)
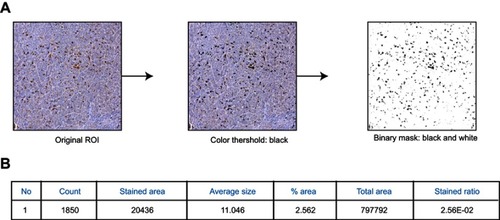
Figure S3 Flow cytometry and confocal microscopy images in the presence of catalase. NR fluorescence ratio of released NR (red channel – FL5) vs entrapped NR (green channel – FL1) from P1 NPs (blue) and P2 NPs (green) without catalase or after the 16-hr pretreatment with catalase (A). Confocal images of NR-loaded P1 NPs (B) and P2 NPs (C) in PC-3 cells after a 16hr pretreatment with catalase. Red shows the fluorescence from released and quenched NR and green shows the fluorescence from the particle-trapped, non-quenched NR; the blue color shows the Hoechst-stained nucleus. Error bars show SD. Asterisks indicate statistical significance obtained by one-way ANOVA and Tukey’s multiple comparisons post-hoc test. *P<0.05, **P<0.01 (n=3)
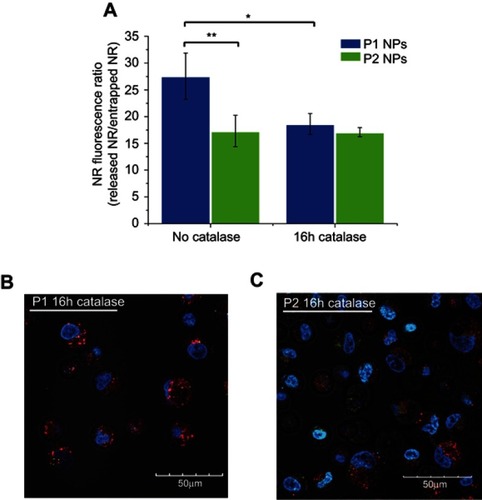
Figure S4 Toxicity of P1 NPs, P2 NPs and nab-PTX in healthy mice. Weight change (%) in healthy mice after treating with 40 or 60 mg/kg PTX containing P1 NPs, P2 NPs or nab-PTX. Error bars show SEM
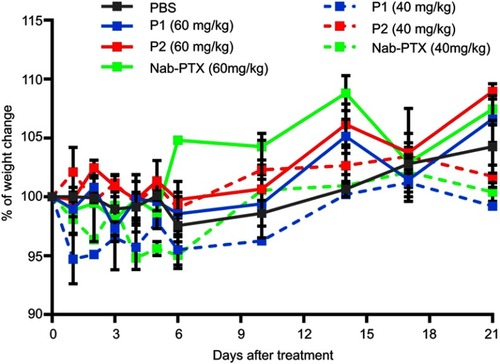
Figure S5 Photomicrographs of HeLa tissue samples labeled with CD68, iNOS or CD206. Photomicrographs of untreated tissue (A), and following treatment with P1 NPs (B), P2 NPs (C), nab-PTX (D) and PTX (E). Scale bar: 250 µm
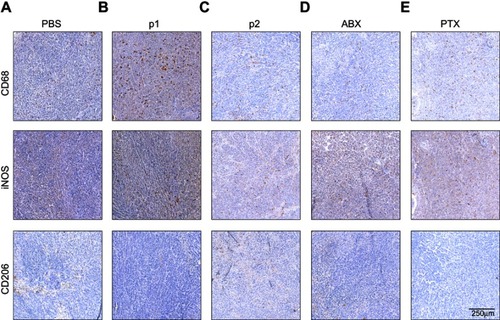
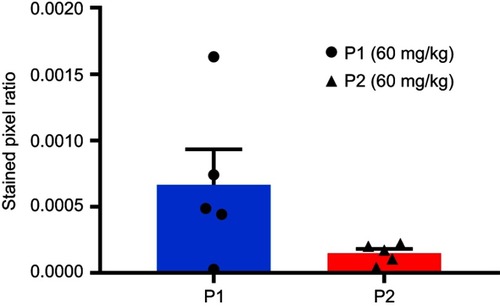
Figure S6 Expression of the NK cell marker NCR1 quantified in P1 NPs and P2 NPs treated tumors. Calculation of the stained pixel ratio was performed as illustrated in . Data are shown as mean-stained pixel ratio±SEM (n=5 random regions in each tumor). The difference was not statistically significant