Figures & data
Figure 1 The morphology and characterization of PtNPs. (A and B) Transmission electron microscopy (TEM) images of PtNP-5 and PtNP-70 in the culture medium, respectively. (C and D) Zeta potentials, respectively, for PtNP-5 and PtNP-70 in different solutions 5 mins after incubation. (E and F) Hydrodynamic diameters, respectively, for PtNP-5 and PtNP-70 in different solutions 5 mins after incubation.
Abbreviations: PtNP, platinum nanoparticle; PtNP-5 and PtNP-70, platinum nanoparticles with diameters of 5 and 70 nanometers.
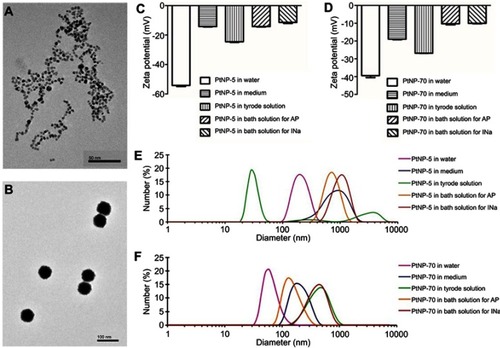
Figure 2 The hazardous effects of PtNP-5 and PtNP-70 on the transmembrane potentials (TMPs) of cultured neonatal cardiomyocytes. (A) PtNP-5. (B) PtNP-70. Note that both PtNP-5 and PtNP-70 concentration-dependently depolarized the RP, decreased the APA and prolonged the APD within 5 mins after exposure.
Abbreviations: RP, resting potential; AP, action potential; APA, action potential amplitude; APD, action potential duration.
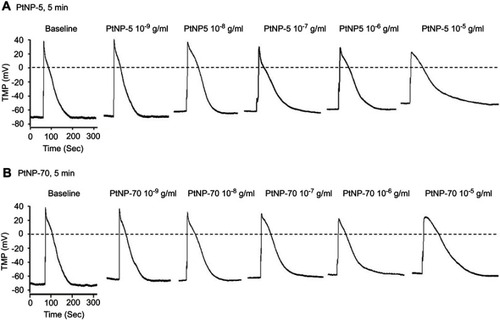
Figure 3 The concentration-dependent inhibitory effects of PtNPs on INa channels in cultured neonatal mice cardiomyocytes. (A and B) Typical INa current tracings at baseline and after exposure to PtNP-5 and PtNP-70 (10–9 – 10–5 g/mL) for 5 mins, respectively. (C and D) The I–V curves of INa channels for PtNP-5 and PtNP-70, respectively. **P<0.01 vs the corresponding value of the control.
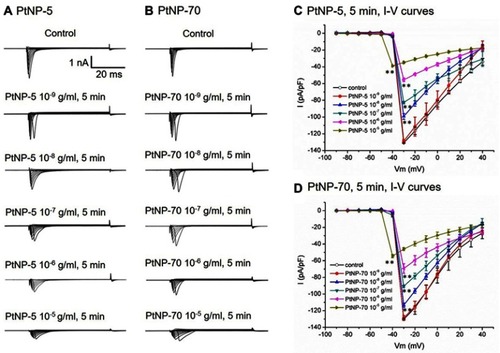
Figure 4 The suppressing effects of PtNP-5 and PtNP-70 (10–7 g/mL) on the IK1 channel currents in cultured neonatal cardiomyocytes. (A) Typical IK1 current tracings at baseline (control) and after exposure, respectively, to PtNP-5 and PtNP-70 for 5 mins. (B) The I–V curves of IK1 channels at baseline and after exposure to PtNP-5 and PtNP-70 for 5 mins. (C) the activation curves of IK1 channels at baseline and after exposure to PtNP-5 and PtNP-70 for 5 mins. Note that both PtNP-5 and PtNP-70 decreased the IK1 current densities but did not significantly affect the channel activation kinetics. * P<0.05, ** P<0.01 vs the corresponding value of control.
Abbreviations: Vm, membrane potential; I-V curve, current/voltage curve.
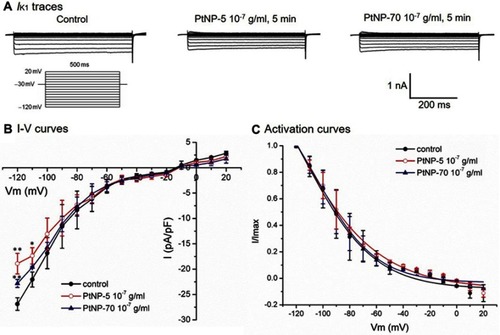
Figure 5 The suppressing effects of PtNP-5 and PtNP-70 (10–7 g/mL) on the Ito channels in cultured neonatal cardiomyocytes. (A) Typical Ito current tracings at baseline and after exposure to PtNP-5 and PtNP-70 for 5 mins. (B) I–V curves of Ito channels at baseline and after exposure to PtNP-5 and PtNP-70 for 5 mins. (C) The activation curves of Ito channels at baseline and after exposure to PtNP-5 and PtNP-70 for 5 mins. Note that both PtNP-5 and PtNP-70 decreased the Ito current densities but did not significantly affect the channel activation kinetics. *P<0.05, **P<0.01 vs the corresponding value of control.
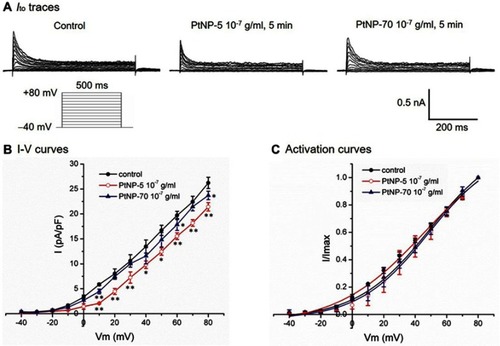
Figure 6 Representative ECGs showing the effects of intravenous PtNP-5 (10 mg/kg) on the heart rate and rhythm of a mouse in vivo. PtNP-5 at this dose successively decreased the heart rate, prolonged the P-R intervals (degree I AVB) and induced complete atrio-ventricular conduction block (AVB) (degree III AVB) within the observed 90 mins. PtNP-5 did not induce ventricular tachyarrhythmias or cardiac asystole within 90 mins.
Abbreviations: ECG, electrocardiogram; P, P wave; QRS-T, QRS complex and T wave; F, fusion of P wave with QRS complex; R, R wave.
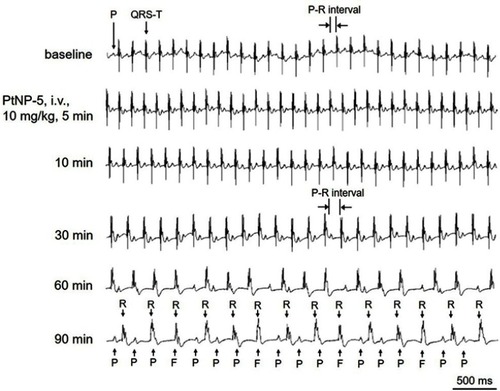
Figure 7 Representative ECGs showing the effects of intravenous PtNP-70 (8 mg/kg) on the heart rate and rhythm of a mouse in vivo. PtNP-70 at this dose had similar effects on the heart rate and rhythm as that did by PtNP-5, ie, the ECGs successively showed heart rate slowing, P-R interval prolongation and complete atrio-ventricular conduction block (AVB), but the animals did not die within the observed 90 mins.
Abbreviations: P, P wave; QRS-T, QRS complex and T wave; F, fusion of P wave with QRS complex; R, R wave.
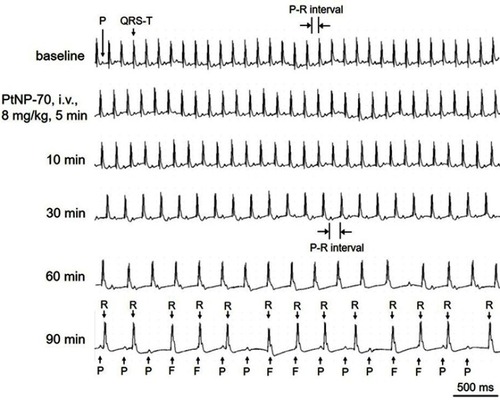
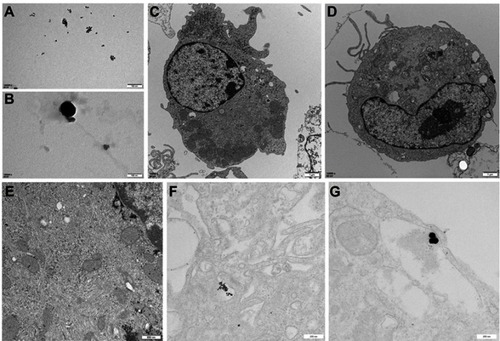
Figure 8 Transmission electron microscopy (TEM) images showing the internalization of PtNP-5 and PtNP-70 (both 10–5 g/mL) in cultured neonatal mice cardiomyocytes before and after exposure for 5 mins and 1 hr. (A) Extracellular PtNP-5. (B) Extracellular PtNP-70. (C) A control cardiomyocyte without exposure to PtNPs. (D) A cardiomyocyte exposed to PtNP-5 for 5 mins, no PtNP-5 was observed inside the cell. (E) A cardiomyocyte exposed to PtNP-70 for 5 mins, no PtNP-70 was observed inside the cell. (F) A cardiomyocyte exposed to PtNP-5 for 1 hr, PtNP-5 was observed inside the cytoplasmic vesicles, indicating PtNP-5 internalization. (G) A cardiomyocyte exposed to PtNP-70 for 1 hr, PtNP-70 was observed inside the cell. Scale bars in panels A through G were, respectively, 100 nm, 100 nm, 1 μm, 1 μm, 200 nm, 500 nm and 200 nm.
Abbreviation: PtNP, platinum nanoparticle.