Figures & data
Figure 1 TEM images of FNs at a magnification of 10 k (A) and 40 k (B).
Abbreviations: TEM, transmission electron microscopy; FNs, magnetic ferrite nanoclusters.
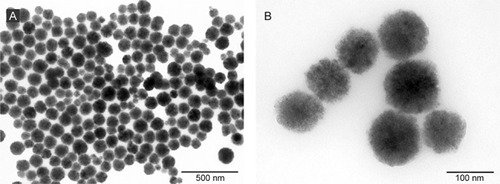
Figure 2 Morphology of microspheres.
Notes: BMs under optical microscope (A); FNMs under optical microscope (B); BMs under ESEM (C); FNMs under ESEM (D); FNMs under TEM at a magnification of 8 k (E) and 50 k (F).
Abbreviations: BMs, blank polymer microspheres; FNMs, magnetic polymer microspheres; ESEM, environmental scanning electron microscope; TEM, transmission electron microscopy.
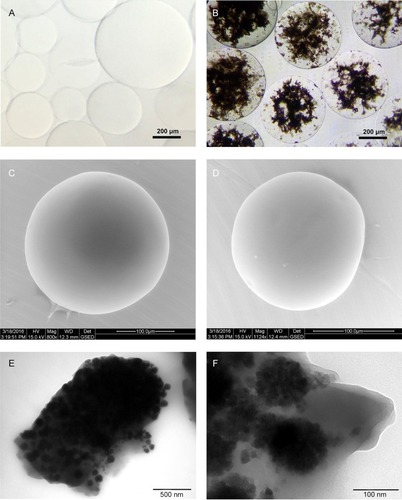
Figure 3 DLS intensity distributions of FNs (A) and size distribution of the BMs (blank column) and FNMs (black column) (B).
Abbreviations: DLS, dynamic light scattering; FNs, magnetic ferrite nanoclusters; BMs, blank polymer microspheres; FNMs, magnetic polymer microspheres.
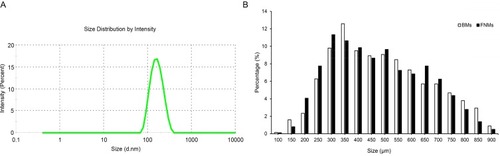
Figure 4 FT-IR spectra of FNs (A), BMs (B) and FNMs (C).
Abbreviations: FT-IR, Fourier transform infrared; FNs, magnetic ferrite nanoclusters; BMs, blank polymer microspheres; FNMs, magnetic polymer microspheres.
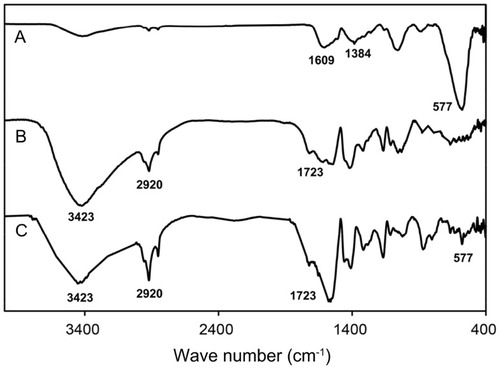
Figure 5 The XRD patterns of FNs (A) and FNMs (B).
Abbreviations: XRD, X-ray diffraction; FNs, magnetic ferrite nanoclusters; FNMs, magnetic polymer microspheres.
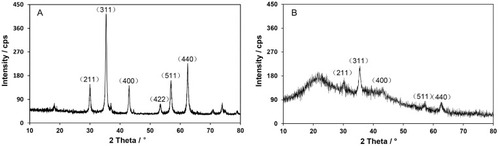
Figure 6 The XPS spectra of FNs and FNMs.
Notes: XPS survey spectrum (A) and Fe 2p XPS spectrum (B) of FNs; XPS survey spectrum (C) and Fe 2p XPS spectrum (D) of FNMs.
Abbreviations: XPS, X-ray photoelectron spectroscopy; FNs, magnetic ferrite nanoclusters; FNMs, magnetic polymer microspheres.
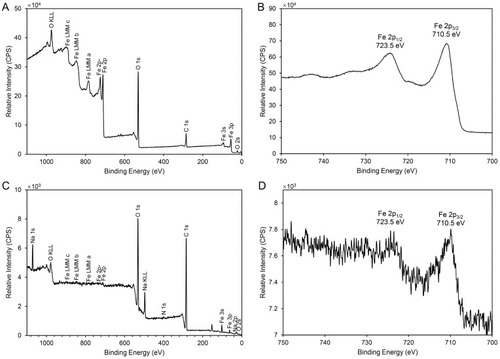
Table 1 The Content Of Fe, Fe3O4, And FNs In The FNMs Of Different Subgroups And Whole Size Range (n=3)
Figure 7 The hysteresis loops of FNs (A) and FNMs (B) at room temperature.
Notes: The inserts in (A) were photographs of the FNs dispersed in the water and responding to external magnetic field, respectively. The inserts in (B) were photographs of the FNMs dispersed in the water and responding to external magnetic field, respectively.
Abbreviations: FNs, magnetic ferrite nanoclusters; FNMs, magnetic polymer microspheres.
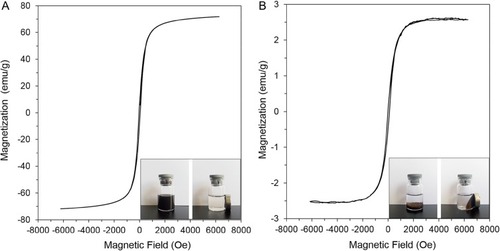
Table 2 Young’s Modulus, Relaxation Half Time (RHT), Failure Deformation, Failure Stress, Springiness, Cohesiveness, And Resilience Of BMs And FNMs (n=3) (Compared With Embospheres)
Figure 8 Compression curves (A) and stress relaxation curves (B) of different microspheres.
Abbreviations: BMs, blank polymer microspheres; FNMs, magnetic polymer microspheres.
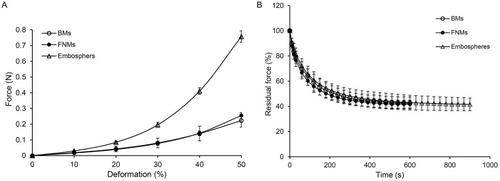
Figure 9 T2 relaxivity measurement of FNs.
Abbreviation: FNs, magnetic ferrite nanoclusters.
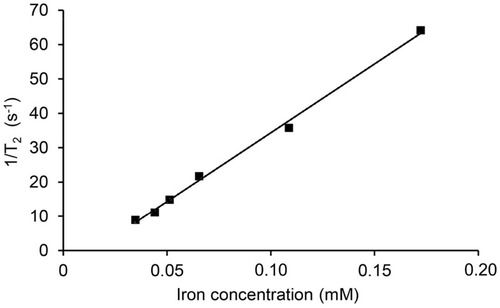
Figure 10 T2-weighted MR images of in vitro gel phantom from left to right column: BMs with the concentration of 32% (v/v) (as controls) and FNMs with concentrations of 4%, 8%, 16%, and 32% (v/v).
Abbreviations: MR, magnetic resonance; BMs, blank polymer microspheres; FNMs, magnetic polymer microspheres.
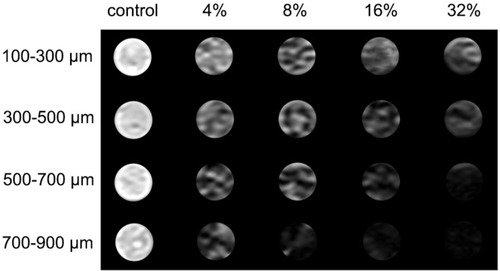
Figure 11 The typical T2-weighted MR images of the same mouse before, immediately after, at 14 d and 28 d after subcutaneous injection of FNMs into the back (A) and the quantificational analysis of signal-to-noise changes at the corresponding time points after the injection into three mice (B).
Note: The arrows denoted the dark signal area induced by FNMs.
Abbreviations: MR, magnetic resonance; FNMs, magnetic polymer microspheres; △SNR, the change of signal-to-noise ratio.
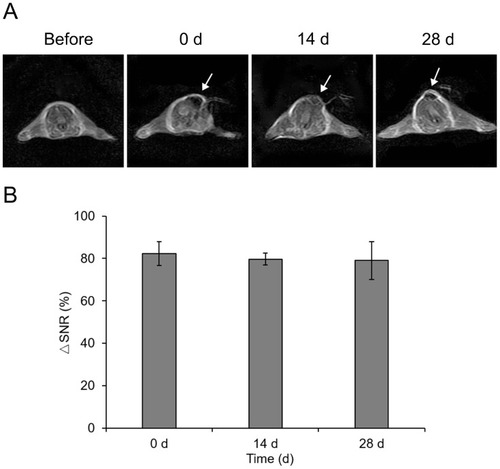
Figure 12 Histological features of mice after subcutaneous injection of FNMs at 2 h (A), 2 d (B), 7 d (C), 14 d (D), and 28 d (E).
Abbreviations: FNMs, magnetic polymer microspheres; ic, inflammatory cells; cf, collagen fibers; bv, blood vessels; ms, microspheres.
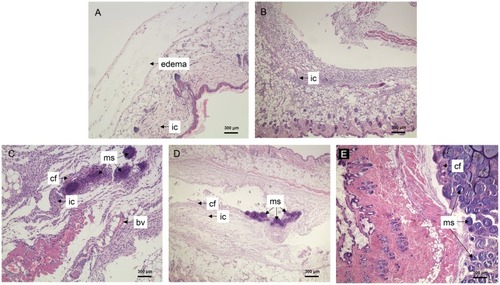
Figure 13 Arterial angiogram of a rabbit’s left kidney, before embolization (A) and immediately after embolization (B).
Note: The peripheral blood vessels were occluded with FNMs (100–300 μm) after embolization.
Abbreviation: FNMs, magnetic polymer microspheres.
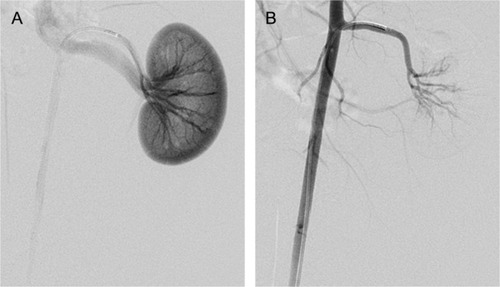
Table 3 △SNR Of The Rabbits Embolized With FNMs In Transverse And Sagittal Images With T2*- And T2-Weighted Sequences (n=2)
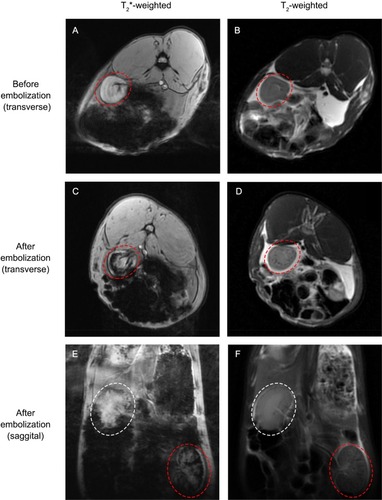
Figure 14 MR images of embolized kidney with T2*- and T2-weighted sequences before and after embolization.
Notes: The rabbit’s left embolized kidney was denoted by red elliptical rings while the right untreated kidney was denoted by white elliptical rings.
Abbreviation: MR, magnetic resonance.