Figures & data
Figure 1 Optical characterizations of K-AuNCs: (A) UV-Vis spectrum of kaempferol and K-AuNCs. (B) PL emission spectra of kaempferol and K-AuNCs. (C) Fluorescence stability of K-AuNCs from 0-120 min and (D) image is emission peak of K-AuNCs corresponding to the different excitation wavelength.
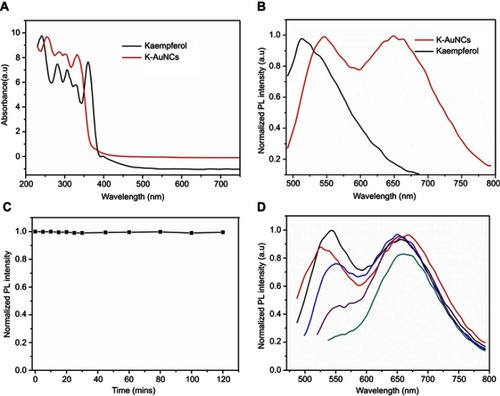
Figure 2 (A) X-ray diffraction spectrum of K-AuNCs and (B) FTIR characterization of kaempferol and K-AuNCs. (i) Pure kaempferol and (ii) is K-AuNCs.
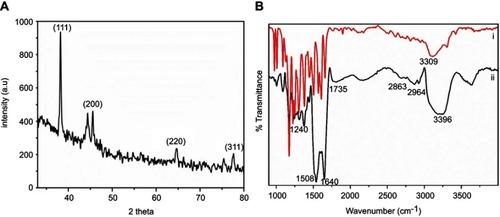
Figure 3 Morphological characterization of K-AuNCs. (A) HR-TEM analysis of K-AuNCs. (B) Bio-AFM height images of K-AuNCs.Notes: Red circles indicate the formation of K-AuNCs and the yellow arrows indicate the Au crystals were organized well.
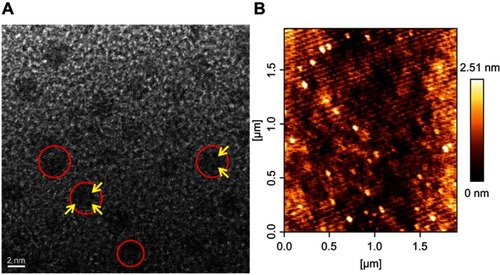
Figure 4 MTT assay to evaluate the cytotoxicity of K-AuNCs on HK-2 human normal kidney cells and A549 lung cancer cell line. Two different concentrations of the formulations namely, 12.5 µg/mL and 25 µg/mL were treated to the normal and lung cancer cells. Cells were then incubated for up to 24 hrs. MTT reagent was added to each well and further incubated in dark for 4 hrs. Following this, the OD was recorded. The percentage of viable cells in each group was calculated and plotted as graph. (A) HK-2 human kidney cell line showed very less cytotoxicity (B) A549 human lung cancer cell line on the other hand showed significant increase in cytotoxicity with increasing concentrations of K-AuNCs. Each value represents the mean ± SE (n=5) *p<0.05. Scale bar=200 µm.Note: ***p<0.001.
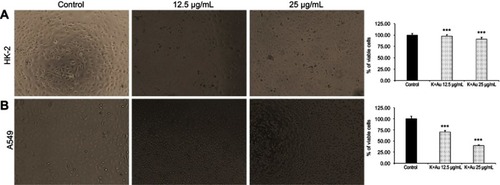
Figure 5 Nuclear damage indicating cell death was evaluated in A549 human lung cancer cell line treated with K-AuNCs. Accordingly, the cells were treated with the desired concentration of K-AuNCs and incubated for 24 hrs. Cells were then fixed and stained with DAPI to visualize the nucleus. A549 cells showed increased nuclear damage upon treatment with K-AuNCs indicating apoptosis in the treated cells. Scale bar=50 µm.
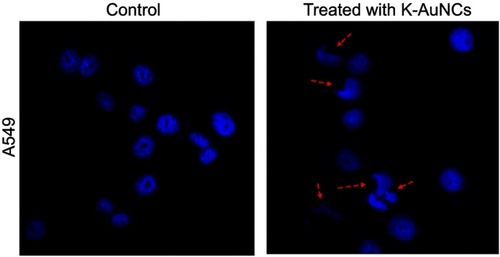
Figure 6 K-AuNCs inhibited the proliferation of A549 human lung cancer cells. Cells were assessed for proliferation with colony formation assay. Accordingly, cells were seeded on a 60-mm dish. Cells were then treated with or without K-AuNCs formulation and incubated further for 2 weeks. Cells were then stained with Crystal Violet and the number of colonies formed in control and K-AuNCs treated groups were observed. K-AuNCs treatment drastically reduced the cell proliferation and number of colonies formed by A549 human lung cancer cell line.
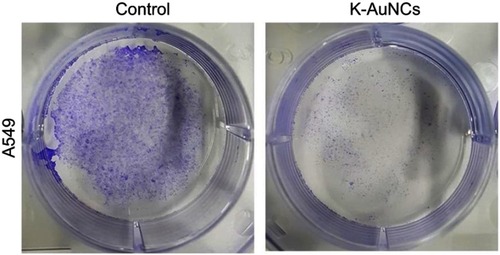
Figure 7 K-AuNCs inhibited the migration of A549 human lung cancer cells. Cells were assessed for migration with wound healing assay. Accordingly, cells were seeded and cultured until confluence was reached. A scratch was made and cells were treated with or without K-AuNCs formulation.The area of the wound was evaluated at 0h and 24h in control and treated cells.Note: *p<0.05.
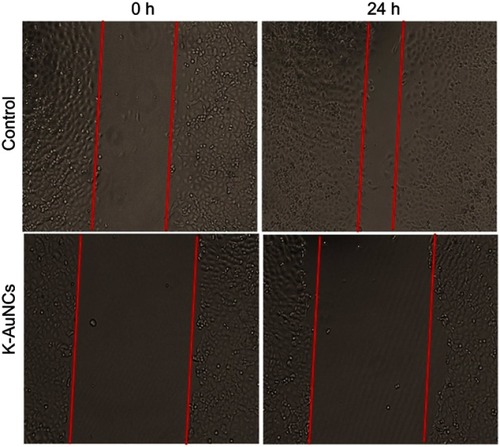
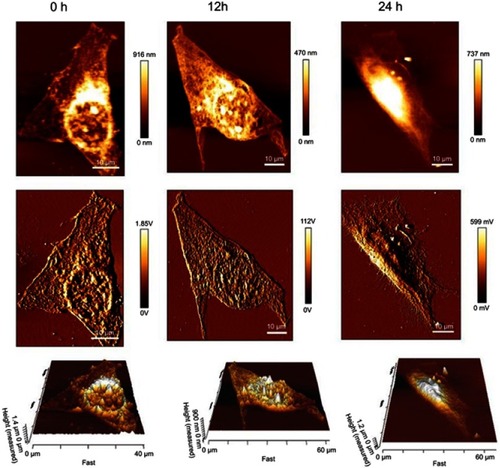
Figure 8 Bio-AFM height, error and 3D images of A549 calls treated with K-AuNCs in different intervals of time from 0, 12, and 24 hrs.
Scheme 1 Schematic diagram of K-AuNCs for anticancer therapy.
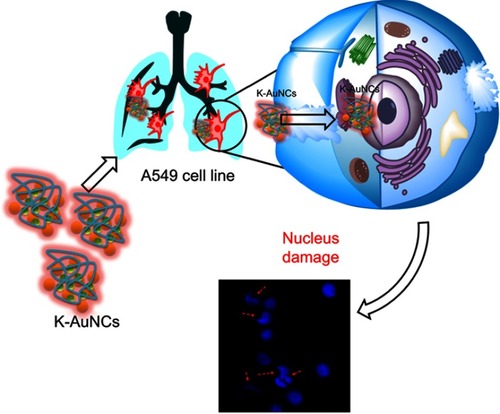
Figure S1 Fluorescence stability of the K-AuNCs was checked with six months before synthesized sample, and it was stored in 4°C. The synthesized material gives good fluorescence intensity. The inset image indicated that red color fluorescence is present under the UV light for the same sample
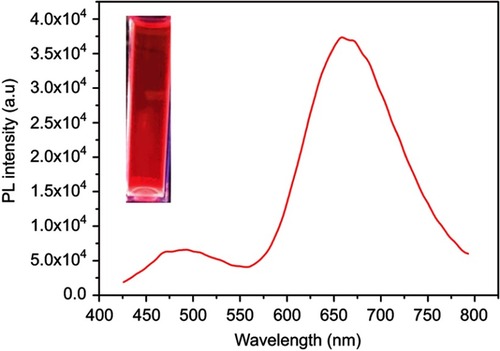
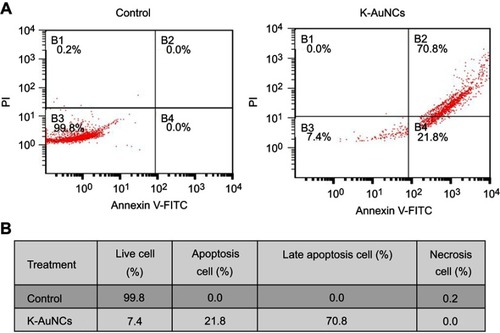
Figure S2 (A) Annixin V-FITC/PI double staining of apoptosis in A549 control or K-AuNCs (12.5 µg/mL) treated cells. (B) Table represents the percentage of cells live and in different stages of apoptosis