Figures & data
Figure 1 XRD pattern of AgNPs@PPE.
Abbreviation: XRD, X-ray diffraction.
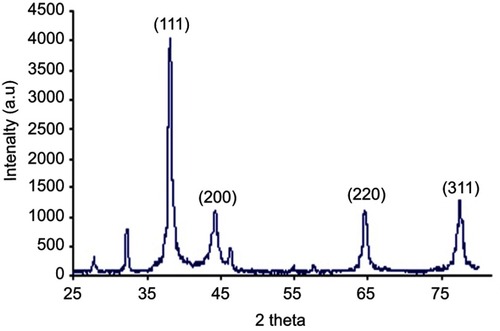
Figure 2 UV-vis and PL spectra of AgNPs@PPE.
Abbreviations: PL, photoluminescence; UV-vis, ultraviolet-vis spectrophotometry.
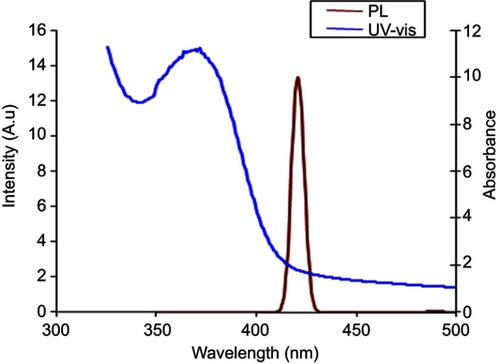
Figure 3 TEM image of the AgNPs@PPE (scale bar is 50 nm).
Abbreviation: TEM, transmission electron microscopy.
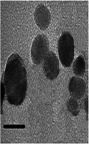
Figure 4 Kinetic of biofilm formation by Psuedamonas aeruginosa at different treatments: (A) AgNPs@PPE and PPE co-treatment; (B) AgNPs@PPE treatment at 6, 12, 18, 24 hrs; (C) PPE treatment at 6, 12, 18, 24 hrs.
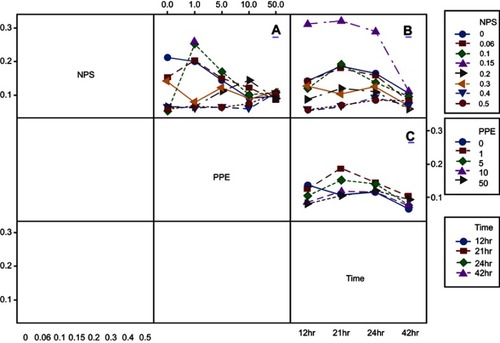
Table 1 Biofilm inhibition (%) of Pseudamonas aeruginosa with AgNPs@PPE and PPE treatments
Table 2 Biofilm inhibition (%) of Pseudamonas aeruginosa with AgNPs@PPE and PPE co-treatments
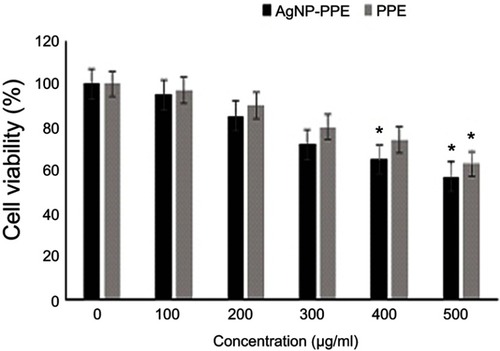
Figure 5 Cells viability of treatments with different concentrations of AgNPs-PPE and PPE after 48 hrs.