Figures & data
Figure 1 Chemical structures of the polymer and the drug.
Note: (A) COS and (B) APO.
Abbreviations: APO, apocynin; COS, chitosan oligosaccharide.
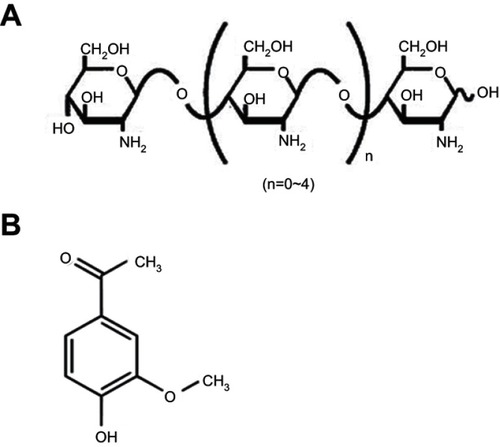
Table 1 Composition and characterization of APO-loaded COS-NPs formulations
Figure 2 FT-IR spectra (A), DSC thermograms (B), and XRD patterns (C).
Notes: (I) APO, (II) COS, (III) TPP, (IV) physical mixture, (V) plain COS-NPs, and (VI) APO-loaded COS-NPs (F4).
Abbreviations: APO, apocynin; COS, chitosan oligosaccharide; DSC, differential scanning calorimetry; FT-IR, Fourier-transform infrared; NPs, nanoparticles; TPP, tripolyphosphate; XRD, X-ray diffractometry.
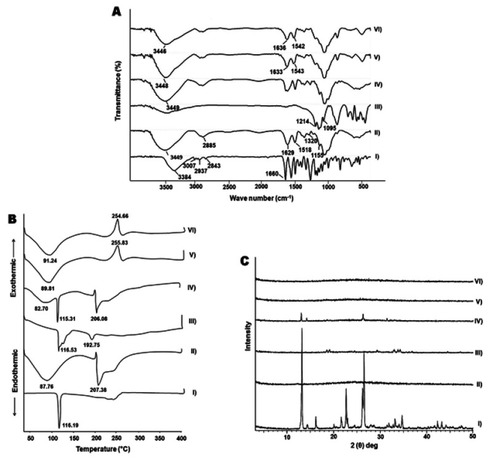
Figure 3 TEM images, size and ZP distribution curves of APO-loaded COS-NPs (F4).
Notes: (A) TEM images with different magnifications, (B) size distribution curve, and (C) ZP distribution curve.
Abbreviations: APO, apocynin; COS, chitosan oligosaccharide; NPs, nanoparticles; TEM, transmission electron microscopy; ZP, zeta potential.
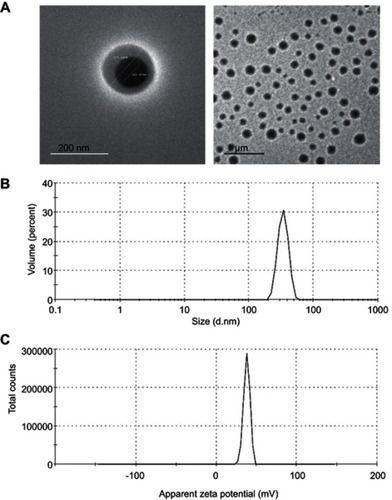
Figure 4 The in vitro release pattern of APO from COS-NPs (F4) in comparison with its diffusion from aqueous solution.
Note: Each point represents the mean ± SD (n=3).
Abbreviations: APO, apocynin; COS, chitosan oligosaccharide; NPs, nanoparticles.
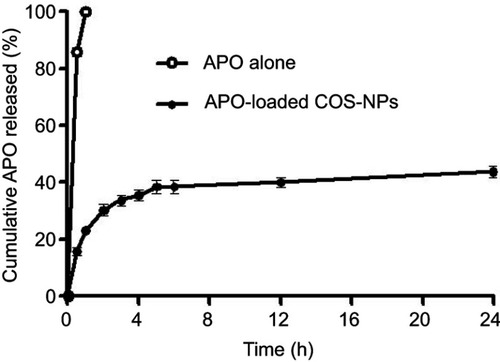
Table 2 Kinetic analysis of the release data of APO from COS-NPs (F4)
Table 3 Stability study data of APO-loaded COS-NPs (F4) after storage at refrigerated (4±1°C) and room (25±2°C/60±5% RH) temperatures
Table 4 Macroscopic evaluation parameters of concurrent induction and treatment regimen and post-treatment regimen aganist KP-induced gastric ulcer in rats
Figure 5 Macroscopic gross appearance of gastric mucosal tissues following (A) concurrent induction and treatment regimen and (B) post-treatment regimen.
Notes: (I) Normal control group, (II) positive control group, (III) free APO treated group, and (IV) APO-loaded COS-NPs (F4) treated group. Oral dose of free or loaded APO was 14 mg/kg.
Abbreviations: APO, apocynin; COS, chitosan oligosaccharide; NPs, nanoparticles.
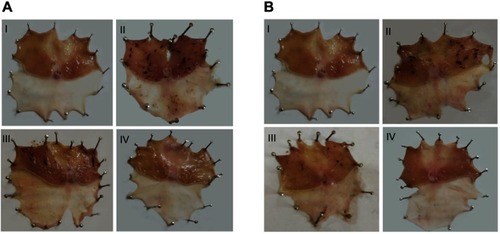
Figure 6 Histopathological examination of glandular stomach of rats following (A) concurrent induction and treatment regimen and (B) post-treatment regimen.
Notes: (I) Normal control group, (II) positive control group, (III) free APO treated group, and (IV) APO-loaded COS-NPs (F4) treated group. Oral dose of free or loaded APO was 14 mg/kg. Thick black arrow points to extensive areas of ulceration. Thick green arrow points to decreased thickness of mucosa due to loss of superficial epithelial layers. Thick red arrows point to focal erosion. Thin black arrows point to congested blood vessels. Thin red arrows point to leukocytic cells' infiltration. Asterisk points to edema. H&E, 100×.
Abbreviations: APO, apocynin; COS, chitosan oligosaccharide; M, mucosa; H & E, hematoxylin and eosin; NPs, nanoparticles; SM, submucosa.
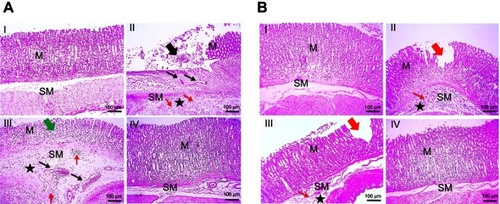
Figure 7 Histochemical staining of glandular stomach of rats with alcian blue stain following (A) concurrent induction and treatment regimen and (B) post-treatment regimen.
Notes: (I) Normal control group, (II) positive control group, (III) free APO treated group, and (IV) APO-loaded COS-NPs (F4) treated group. Oral dose of free or loaded APO was 14 mg/kg. Thick black arrows point to loss of glycoproteins' secretion in mucosa near ulcer. Thick green arrow points to loss of glycoproteins' secretion in mucosa near erosion. Thick red arrow points to decreased glycoproteins' deposition in mucosa near erosion. Thin red arrows point to continued surface glycoproteins. Alcian blue stain, 100×.
Abbreviations: APO, apocynin; COS, chitosan oligosaccharide; M, mucosa; NPs, nanoparticles; SM, submucosa.
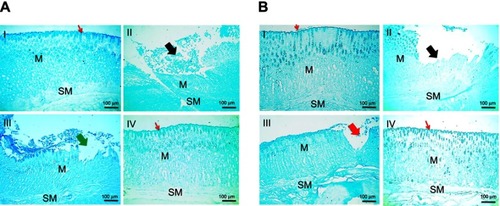
Figure 8 Histochemical staining of glandular stomach of rats with toluidine blue stain following (A) concurrent induction and treatment regimen and (B) post-treatment regimen.
Notes: (I) Normal control group, (II) positive control group, (III) free APO treated group, and (IV) APO-loaded COS-NPs (F4) treated group. Oral dose of free or loaded APO was 14 mg/kg. Thick black arrows point to mucosal damage. Thin black arrows in insert point to mast cells. Thin red arrows point to leukocytic cells' infiltration. Toluidine blue stain, 100× and insert 200×.
Abbreviations: APO, apocynin; COS, chitosan oligosaccharide; M, mucosa; NPs, nanoparticles; SM, submucosa.
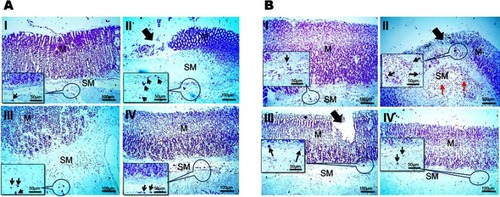
Figure 9 Positive signal for IHC staining of COX-2 in rats’ gastric tissues following (A) concurrent induction and treatment regimen and (B) post-treatment regimen. Statistical analysis of intensity of COX-2 positive signal in rats’ gastric tissues (C) following (a) concurrent induction and treatment regimen and (b) post-treatment regimen.
Notes: (I) Normal control group, (II) positive control group, (III) free APO treated group, and (IV) APO-loaded COS-NPs (F4) treated group. Oral dose of free or loaded APO was 14 mg/kg. Thick black arrows point to strong COX-2 expression in areas of mucosal necrosis. Yellow arrows in insert point to positive signal. IHC counterstained with Mayer’s hematoxylin, 100× and insert 200×. Kruskal–Wallis test (non-parametric test) was applied followed by Dunn's multiple comparison test. *p<0.05 and **p<0.01 vs normal control group. #p<0.05 vs positive control group. $p<0.05 APO-loaded COS-NPs (F4) treated group vs free APO treated group.
Abbreviations: APO, apocynin; COS, chitosan oligosaccharide; COX-2, cyclooxygenase-2; IHC, immunohistochemical; M, mucosa; NPs, nanoparticles; SM, submucosa.
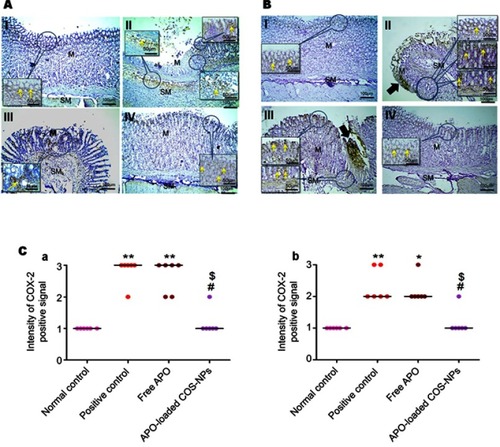
Figure 10 Levels of oxidative stress markers in rats’ gastric tissues following (A) concurrent induction and treatment regimen and (B) post-treatment regimen.
Notes: (a) MDA, (b) SOD, and (c) GSH. Data are mean ± SEM (n=6). * p<0.05, **p<0.01 and ***p<0.001 vs normal control group. #p<0.05 and ###p<0.001 vs positive control group. $p<0.05 and $$p<0.01 APO-loaded COS-NPs (F4) treated group vs free APO treated group.
Abbreviations: APO, apocynin; COS, chitosan oligosaccharide; GSH, reduced glutathione; MDA, malondialdehyde; NPs, nanoparticles; SEM, standard error of the mean; SOD, superoxide dismutase.
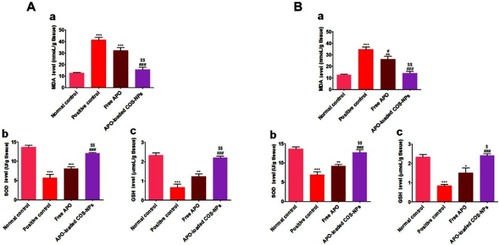
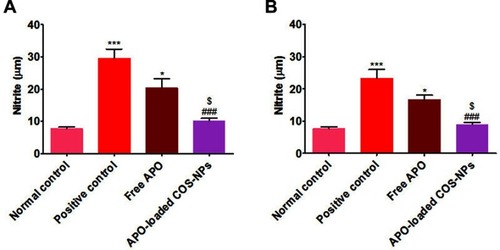
Figure 11 Levels of NO in rats’ gastric tissues following (A) concurrent induction and treatment regimen and (B) post-treatment regimen.
Notes: Data are mean ± SEM (n=6). *p<0.05 and ***p<0.001 vs normal control group. ###p<0.001 vs positive control group. $p<0.05 APO-loaded COS-NPs (F4) treated group vs free APO treated group.
Abbreviations: APO, apocynin; COS, chitosan oligosaccharide; NO, nitric oxide; NPs, nanoparticles; SEM, standard error of the mean.