Figures & data
Figure 1 Formulation variables influencing the formulation performance of QUE-cPLNs, including QUE content in the formulation (A), the ratio of PLGA to lecithin (B), and the cholate concentration in the aqueous phase upon preparation (C).
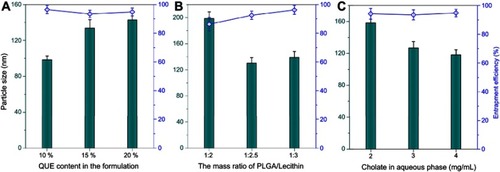
Figure 2 Characterization of QUE-PLNs and QUE-cPLNs.
Note: Particle size distribution (A) and TEM micromorphology (B).
Abbreviations: QUE, quercetin; PLNs, polymer-lipid hybrid nanoparticles; cPLNs, cholate-modified polymer–lipid hybrid nanoparticles.
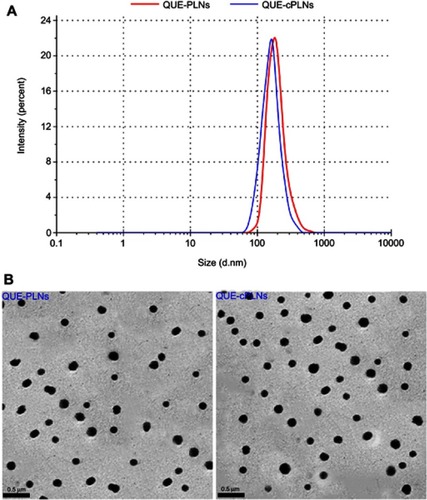
Figure 3 In vitro release profiles of QUE from QUE-cPLNs in water, 0.1 M HCl solution and pH 6.8 PBS.
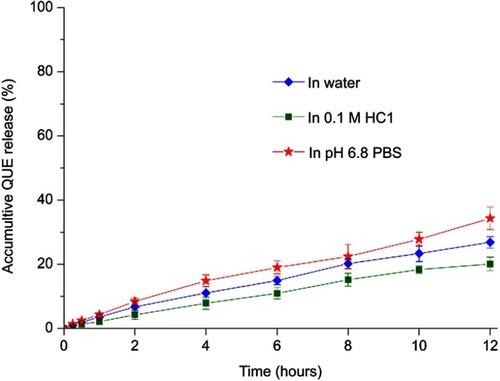
Table 1 Comparative pharmacokinetic parameters of QUE in rats after oral administration of QUE suspensions, QUE-PLNs and QUE-cPLNs
Figure 4 Pharmacokinetic profiles of QUE in rats after oral administration of Que suspensions, QUE-PLNs and QUE-cPLNs at a dose of 25 mg/kg (n=6).
Abbreviations: QUE-PLNs, quercetin-loaded polymer–lipid hybrid nanoparticles; QUE, quercetin.
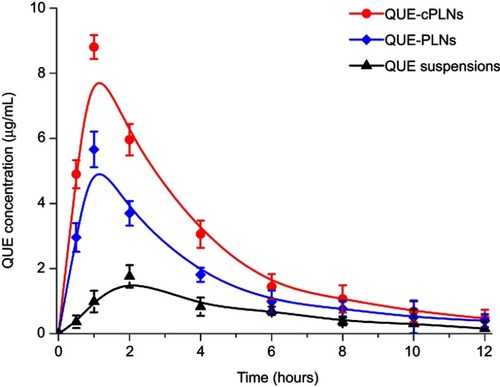
Figure 5 Cellular uptake and internalization of free and formulated QUE in Caco-2 cells.
Notes: (A) Cellular uptake of free QUE, QUE-PLNs and QUE-cPLNs (in the absense of presence of sodium taurocholate) at different incubation time quantified by the intracellular QUE concentration, data expressed as mean ± SD (n=3), paired t-test, **P<0.01, significantly different comapred with each other. (B) Cellular internalization of QUE-PLNs and QUE-cPLNs characterized by intracellular fluorescence intensity.
Abbreviations: QUE, quercetin; QUE-PLNs, quercetin-loaded polymer–lipid hybrid nanoparticles.
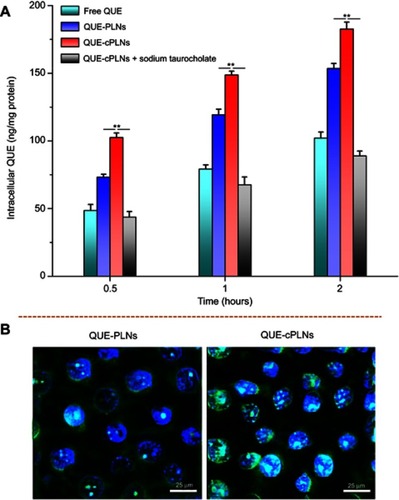
Figure 6 Cytotoxic effects of free QUE, QUE-PLNs and QUE-cPLNs on P388 cells evaluated by the relative cell viability using MTT test.
Notes: Data shown as mean ± SD (n=3), paired t-test, **P<0.01, significantly different compared with each other.
Abbreviations: QUE, quercetin; QUE-PLNs, quercetin-loaded polymer–lipid hybrid nanoparticles;
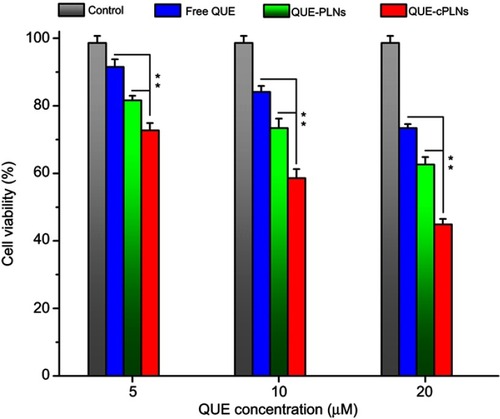
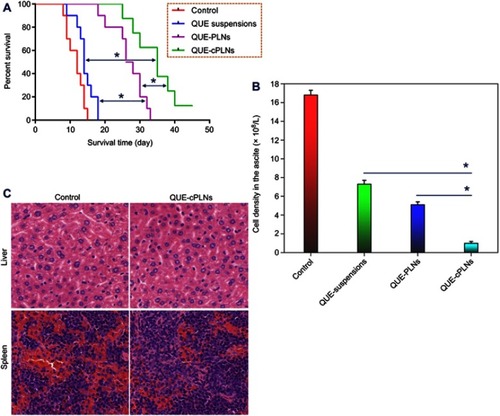
Figure 7 In vivo antileukemic effects of QUE suspensions, QUE-PLNs and QUE-cPLNs in P388 cells-induced murine asceitic leukemia.
Notes: (A) The survival curves of leukemic mice treated with saline (control), QUE suspensions, QUE-PLNs and QUE-cPLNs (n=10), ANOVA, **P<0.01. (B) The cell density in the ascetes of surviving mice after treatment for two weeks, paired t-test, **P<0.01, significantly different compared with each other. (C) The histomorphological changes in the liver and spleen after treatment with saline and QUE-cPLNs.