Figures & data
Scheme 1 The synthetic route of RNase A@ZIF-8 nanoparticles through biomimetic mineralization.
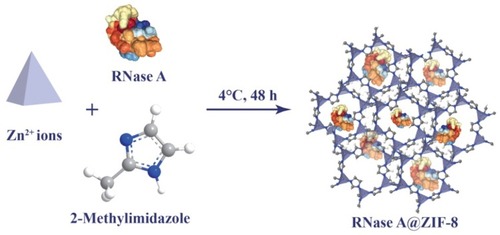
Figure 1 (A) The TEM images of ZIF-8 (a) and RNase A@ZIF-8 nanoparticles (b). Scale bar: 200 nm. (B) The SEM images of ZIF-8 (a) and RNase A@ZIF-8 nanoparticles (b). Scale bar: 200 nm. (C) The XRD pattern of ZIF-8 and RNase A@ZIF-8 nanoparticles.
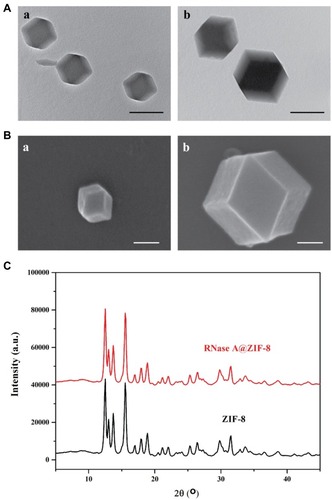
Figure 2 (A) The CLSM image of FITC-RNase A@ZIF-8 nanoparticles. Scale bar: 100 μm. (B and C) Elements mapping analysis of ZIF-8 and RNase A@ZIF-8 nanoparticles.
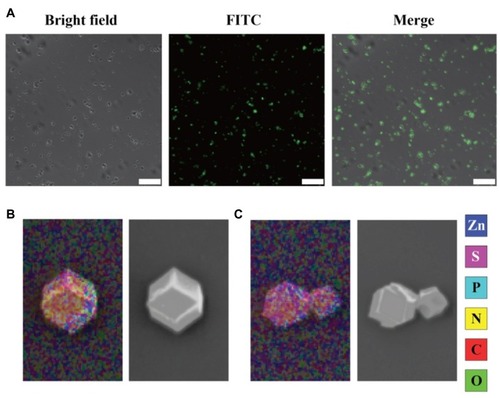
Figure 3 (A) The FT-IR spectra, (B) TGA curves, (C) CD spectra, and (D) nitrogen-adsorption-desorption isotherm curves of RNase A, ZIF-8 and RNase A@ZIF-8 nanoparticles.
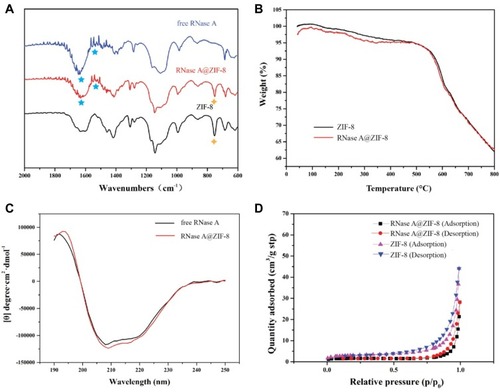
Figure 4 The RNase A release profile of RNase A@ZIF-8 in pH 5.0, 6.0 and 7.0, respectively. The data were expressed as mean value ± SD (*p < 0.05; **p < 0.01, and ***p < 0.001).
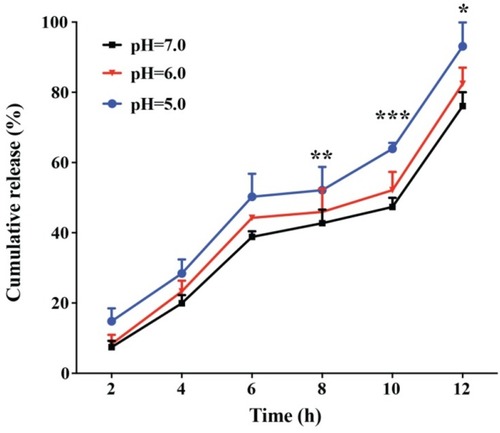
Figure 5 The cellular uptake of free FITC-labeled RNase A and FITC-RNase A@ZIF-8 nanoparticles. The images were acquired with 10 × magnification (scale bar: 100 μm), and the enlarged ones were obtained with 40 × magnification (scale bar: 20 μm).
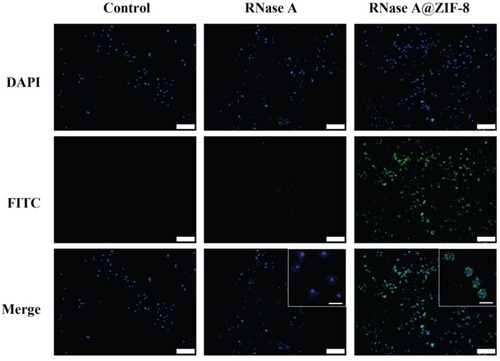
Figure 6 The anti-proliferative assay of RNase A@ZIF-8 nanoparticles against A549 cells through MTT (A), LDH release method (B), and TUNEL staining assay (C). The data were expressed as mean value ± SD (*p < 0.05; **p < 0.01, and ***p < 0.001). Scale bar: 50 μm.
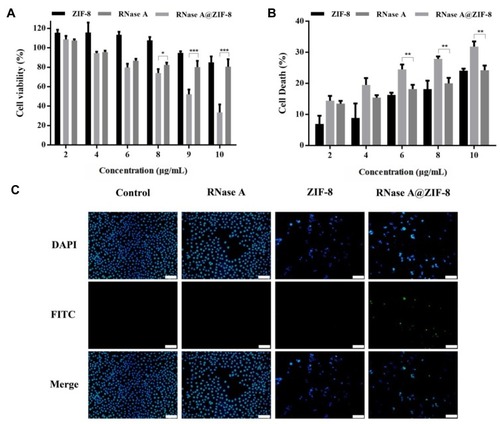
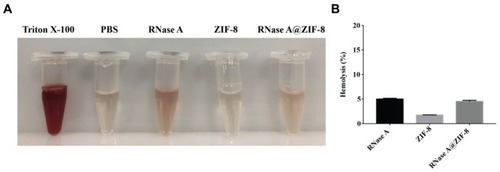
Figure 7 Visual observation (A) and hemolytic activity (B) of free RNase A, ZIF-8 and RNase A@ZIF-8 nanoparticles. The data were expressed as mean value ± SD.