Figures & data
Figure 1 Fluorescence quenching of CAT in the presence of different concentrations of SiO2 NPs: 0 (red), 1 (blue), 5 (purple), 10 (grey), 15 (yellow) and 20 μM (green) at 298 (A), 310 (B) and 315 K (C).
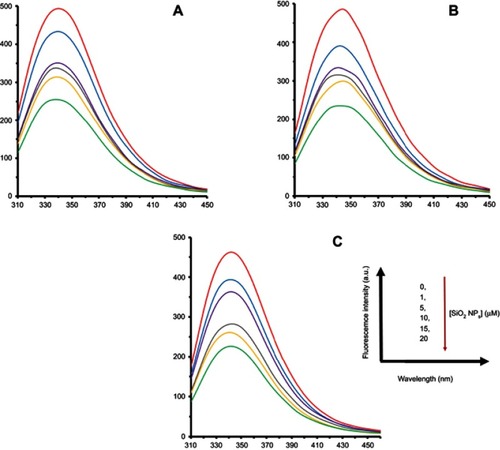
Table 1 The KSV and kq values for the SiO2 NPs/CAT complex at three different temperatures
Figure 2 Stern–Volmer plots of CAT in the presence of different concentrations of SiO2 NPs at 298 (blue), 310 (orange) and 315 K (grey).
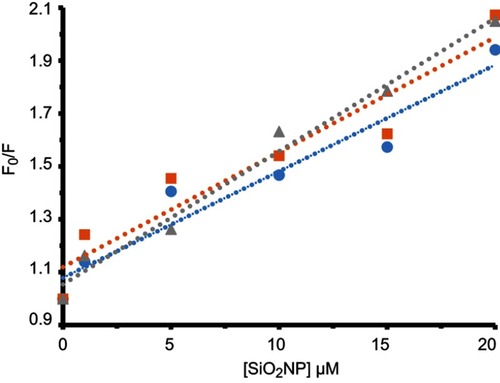
Figure 3 Modified Hill plot of CAT in the presence of different concentrations of SiO2 NPs at 298 (blue), 310 (orange) and 315 K (grey).
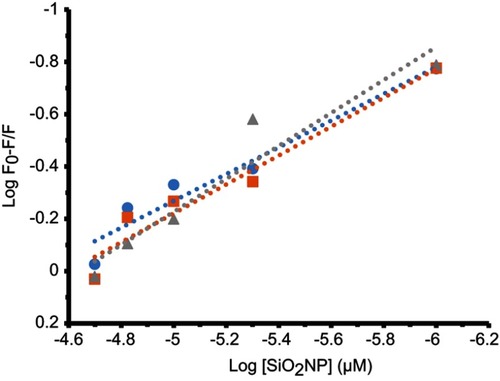
Table 2 The n and logKb values for the SiO2 NPs/CAT complex at different temperatures
Figure 4 van’t Hoff plot of CAT in the presence of SiO2 NPs at 298, 310 and 315 K.
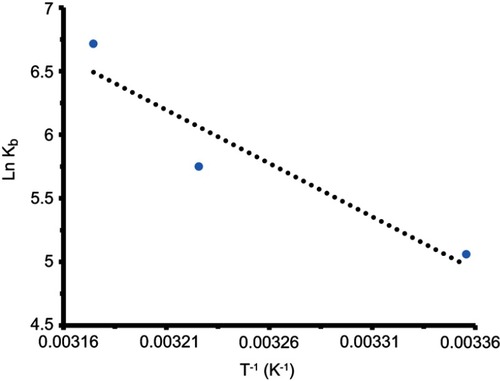
Table 3 The thermodynamic parameters of SiO2 NPs/CAT complex at three different temperatures
Figure 5 CD spectra of CAT in the presence of different concentrations of SiO2 NPs: 0 (black), 5 (red), 10 (blue) and 20 μM (green), at room temperature.
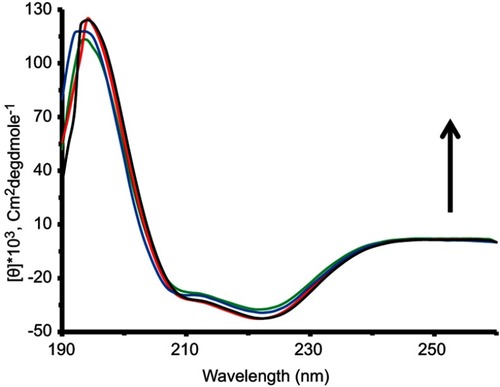
Table 4 The kinetic parameters of CAT in the presence of varying concentrations of SiO2 NPs
Figure 6 The docked (SiO2)72/CAT (A) and Si20/CAT (B) systems.
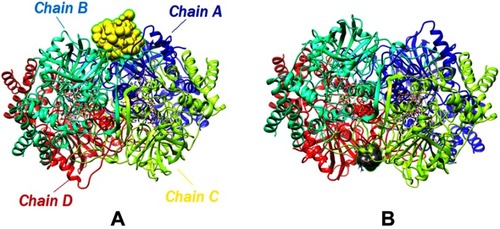
Figure 7 The interacting residues of CAT with (SiO2)72 cluster from two different view angles.
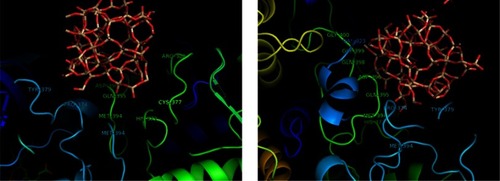
Figure 8 The interacting residues of CAT with Si20 cluster from two different view angles.
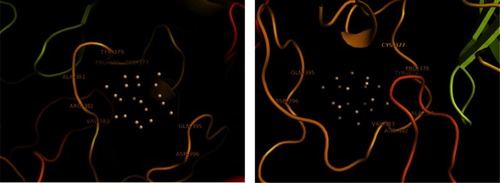
Figure 9 SiO2 cluster/CAT complex in the beginning and after 200 ps simulation.
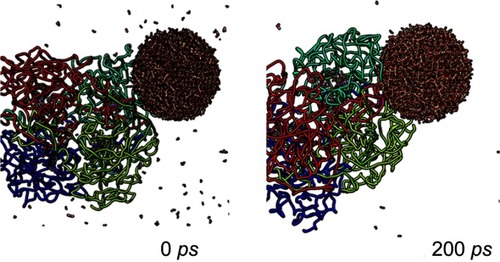
Figure 10 SiO2 NPs (up to 200 μg/mL) decrease the viability of hMSCs. The cells were incubated with varying concentrations of SiO2 NPs for 24 hrs before MTT assay was carried out. *P<0.05 compared to the control group.
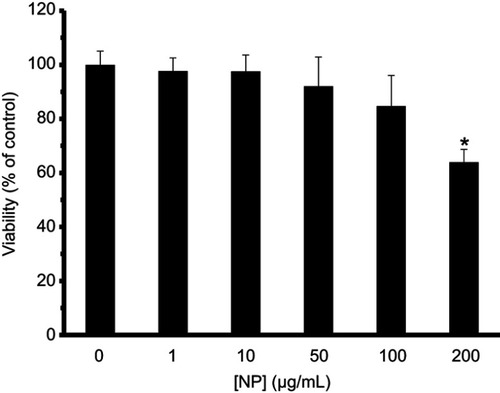
Figure 11 Cellular internalization of SiO2 NPs into the hMSCs. (A) Control cells and (B) treated cells with SiO2 NPs (200 μg/mL).
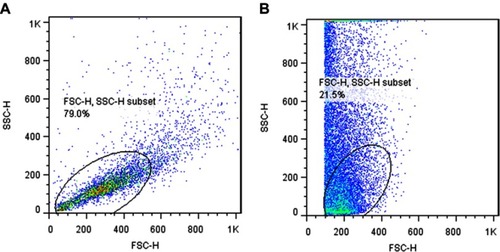
Figure 12 Morphological changes of hMSCs induced by different concentrations of SiO2 [0 (A), 10 (B), 50 (C), 100 (D) and 200 µg/mL (E)].
![Figure 12 Morphological changes of hMSCs induced by different concentrations of SiO2 [0 (A), 10 (B), 50 (C), 100 (D) and 200 µg/mL (E)].](/cms/asset/56aa029e-e99e-4223-8fb7-3599fd76c75a/dijn_a_210136_f0012_c.jpg)
Figure 13 SiO2 NPs cause no increase in the level of LDH in cell culture medium. hMSCs cells were incubated with varying concentrations of SiO2 NPs for 24 hrs before examining the LDH activity of cell culture medium.
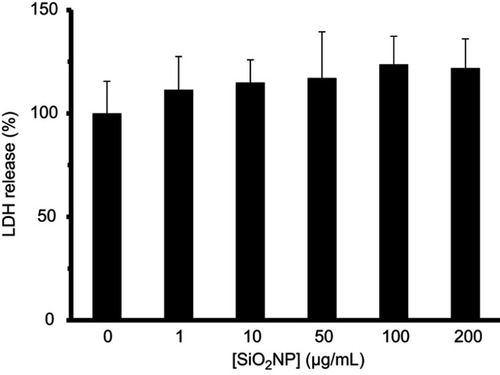
Figure 14 SiO2 NPs at concentrations of 100 and 200 μg/mL increase the level of ROS in hMSCs. hMSCs cells were incubated with SiO2 NPs for 24 hrs before the ROS level was examined. *P<0.05 compared to control group.
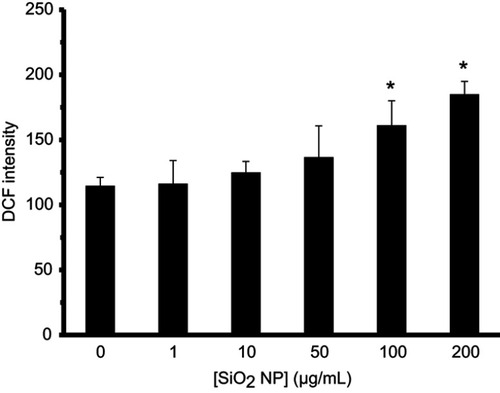
Figure 15 SiO2 NPs at concentration of 200 μg/mL activate caspase-3 in hMSCs. hMSCs cells were incubated with varying concentrations of SiO2 NPs for 24 hrs before the caspase-3 activity was assessed. *P<0.05 compared to control group.
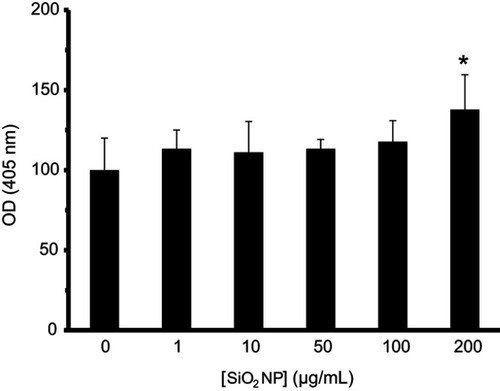
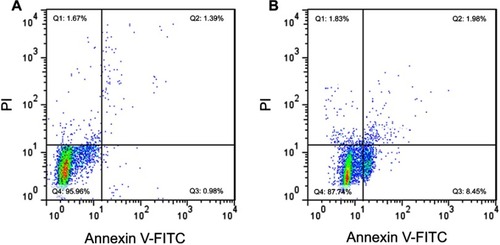
Figure 16 hMSCs cells were incubated with 200 μg/mL of SiO2 NPs for 24 hrs, then co-stained with Annexin V-FITC/PI to quantify the apoptosis induction. (A) Control cells and (B) SiO2 NPs-treated cells.