Figures & data
Figure 1 Schematic of preparation for fabrication of Alg-CS-Flu scaffolds.
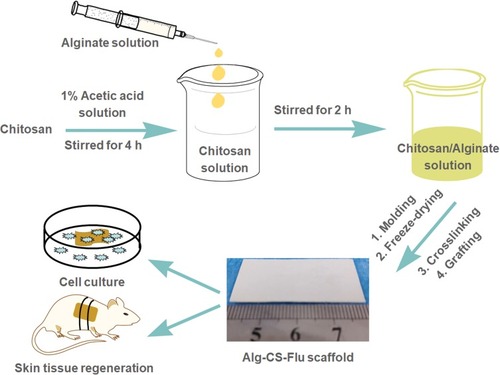
Figure 2 Surface SEM images and WCAs (images of drops captured at 0.5 s) of scaffolds: (A), (A′), and (A″) Alg/CS scaffold; (B), (B′), and (B″) Alg-CS scaffold; (C), (C′), and (C″) Alg-CS-Flu scaffold.
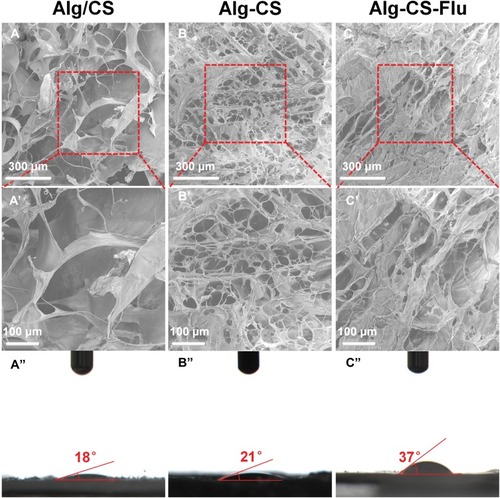
Figure 3 Cross-sectional SEM images of scaffolds: (A and A′) Alg/CS scaffold; (B and B′) Alg-CS scaffold; (C and C′) Alg-CS-Flu scaffold.
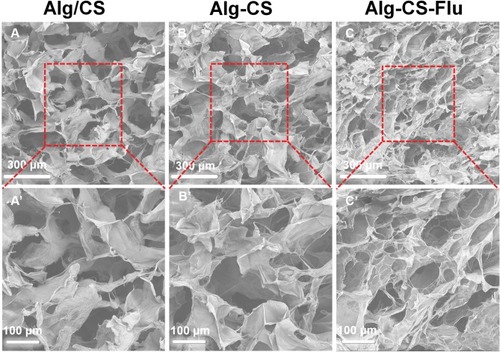
Figure 4 Formation mechanisms of Alg-CS-Flu molecule: crosslinking and grafting with EDC/NHS solution.
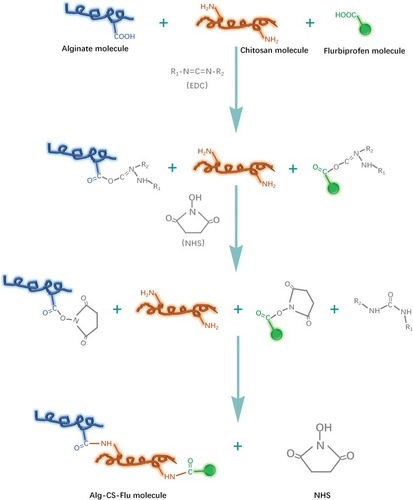
Figure 5 (A) Molecules of CS, Alg, and Flu; (B) WAXRD patterns of Alg/CS, Alg-CS, and Alg-CS-Flu scaffolds; (C) TG curves of Alg/CS, Alg-CS, and Alg-CS-Flu scaffolds; inset shows the DTG curves of scaffolds.
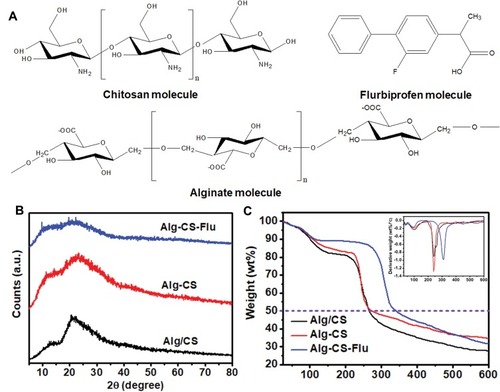
Figure 6 (A) Representative stress–strain curves; (B) Young’s modulus; (C) photographs of fracture of scaffold strips; cyclic tensile response curves at 50% deformation of (D) and (G), Alg/CS scaffold, (E) and (H) Alg-CS scaffold, and (F) and (I) Alg-CS-Flu scaffold in dry states. **indicates significant difference at p<0.01 level.
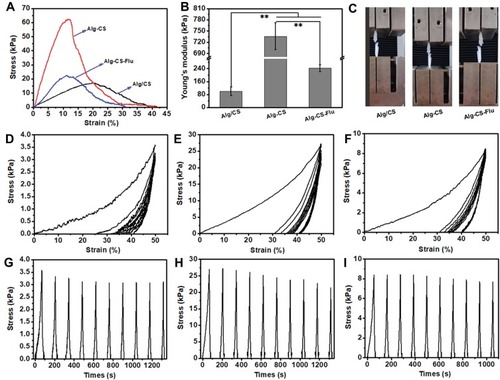
Figure 7 Adhesion viability and proliferation viability of L929 cells after culturing for (A) 12 hrs and (B) 7 d via MTT assay; (C) and (D) DAPI (blue)/rhodamine-conjugated phalloidin (red) staining assay of L929 cells on different scaffolds after culturing for 12 hrs and 5 d, respectively. *p<0.05.
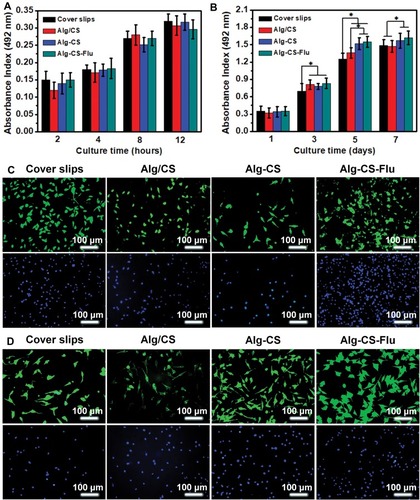
Figure 8 SEM micrographs of L929 cells grown onto (A and A′) coverslips; (B and B’) Alg/CS scaffold; (C and C’) Alg-CS scaffold; (D and D’) Alg-CS-Flu scaffold after 5-d culture. (A–D) magnified 200 times; (A’–D’) magnified 500 times. The red arrows represent L929 cells.
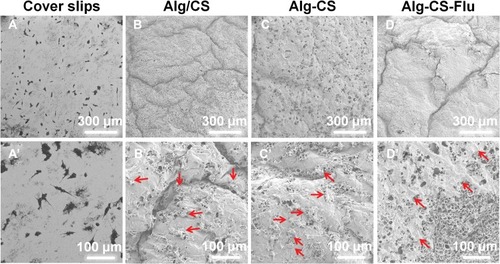
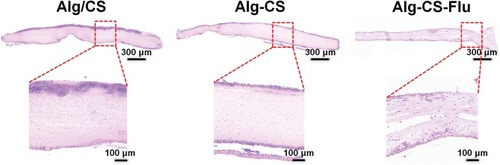
Figure 9 H&E staining images of transplanted Alg/CS, Alg-CS, and Alg-CS-Flu scaffolds after subcutaneous embedding in mice for 7 d.