Figures & data
Figure 1 Cell immunofluorescence assay. CXCR4 was expressed in MCF-7 cells and C33a cells but not in MDA-MB-468 cells. The nuclei are stained blue, and cell membranes expressing CXCR4 are shown in green.
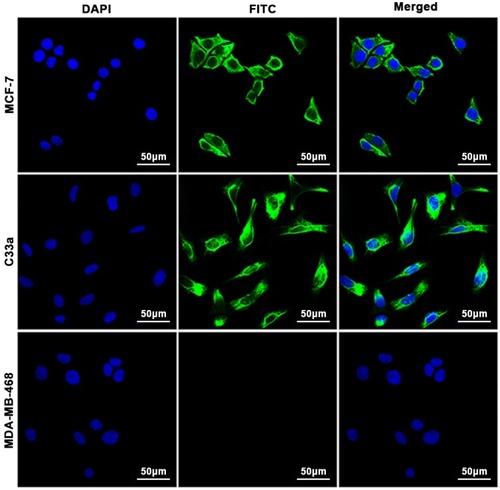
Figure 2 Identification of DSPE-PEG2000-COOH. (A) The 1H NMR spectrum of AMD070. (B) The 1H NMR spectrum of DSPE-PEG2000-COOH. (C) The 1H NMR spectrum of DSPE-PEG2000-AMD070.
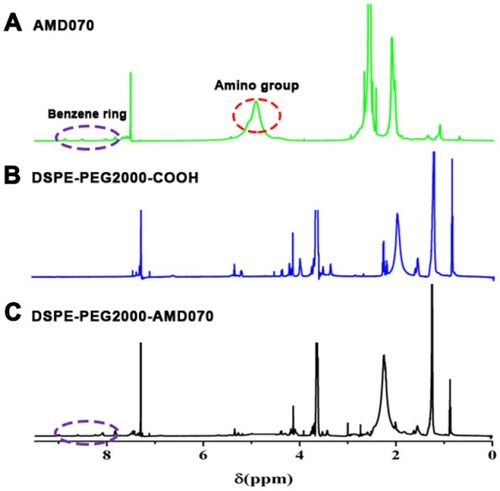
Figure 3 Basic characteristics of the nanobubbles. (A) Observation of PTX-AMD070 NBs under a light microscope. (B) Observation of DiI-labeled PTX-AMD070 NBs under a fluorescence microscope. (C) Observation of PTX-AMD070 NBs under a transmission electron microscope. (D) Spectrum of PTX NB particle sizes. (E) Spectrum of PTX-AMD070 NB particle sizes. (F) An ultrasound image of PTX-AMD070 NBs in vitro. (G) Quantitative analysis of imaging intensity of PTX-AMD070 NBs in vitro. (H) Ultrasound images of PTX-AMD070 NBs in vitro before and after ultrasonic blast. (I) Quantitative analysis of imaging intensity of PTX-AMD070 NBs before and after ultrasonic blast (*P<0.05).
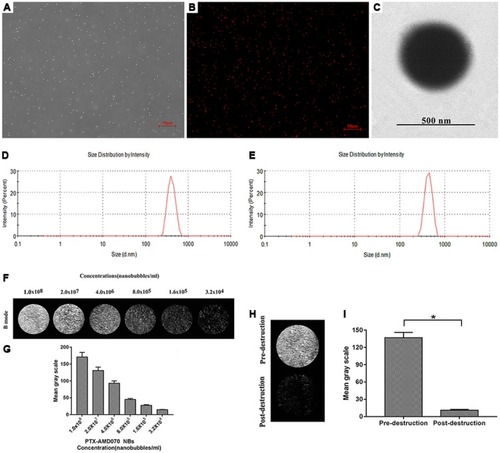
Figure 4 In vitro affinity of nanobubbles for cells. (A) Observation of DiI-labeled PTX-AMD070 NBs binding to MCF-7 cells, C33a cells, and MDA-MB-468 cells under a laser confocal microscope. The nuclei are stained blue; the cell membrane is stained with DiO (green); PTX-AMD070 NBs are stained with DiI (red). (B) Analysis of affinity between nanobubbles and MCF-7 cells determined by flow cytometry. (C) Analysis of affinity between nanobubbles and C33a cells determined by flow cytometry. (D) Analysis of affinity between nanobubbles and MDA-MB-46 cells determined by flow cytometry. (E) Quantitative analysis of affinity between the two types of nanobubbles and three types of cells. *There was significant difference between the cell binding ability of PTX-AMD070 NBs and PTX NBs (P<0.05).
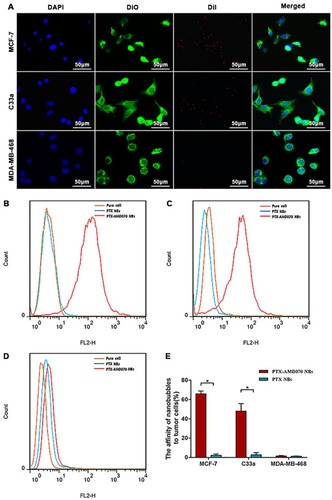
Figure 5 Examination of tumor proliferation suppression ability in vitro using CCK-8 assays. (A) Tumor proliferation suppression ability of AMD070 and PTX at different concentrations. *The survival rate of MCF-7 cells was significantly different from that of cells without drug treatment (P<0.05). #The survival rate of C33a cells was significantly different from that of cells without drug treatment (P<0.05). ▲The survival rate of MDA-MB-468 cells was significantly different from that cells without drug treatment (P<0.05). (B) Tumor proliferation suppression outcome in different treatment groups. *There was a significant difference in cell survival rate between the two groups (P<0.05).
Abbreviations: NBs, nanobubbles; PTX, paclitaxel; US, ultrasound.
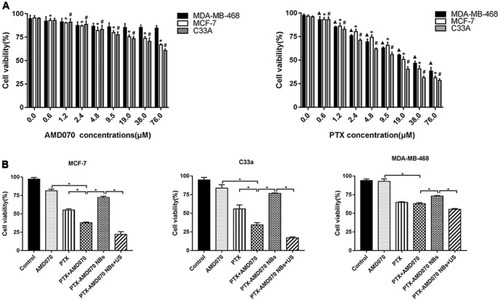
Figure 6 Apoptosis of tumor cells detected by flow cytometry. (A) Apoptosis rates of MCF-7 cells, C33a cells, and MDA-MB-468 cells in the different treatment groups. (B–D) Quantitative comparison of apoptosis rates of MCF-7 cells, C33a cells, and MDA-MB-368 cells between different treatment groups; *There was significant difference in apoptosis rate between the two groups (P<0.05).
Abbreviations: EA, early apoptosis; LA, late apoptosis; TA, total apoptosis.
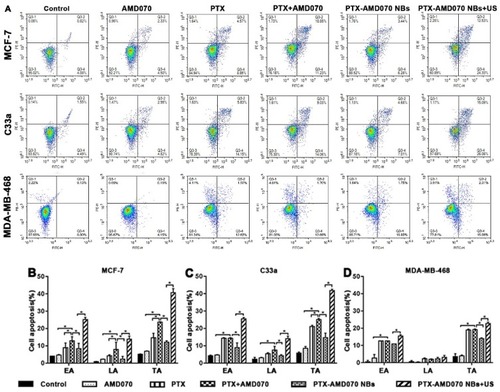
Figure 7 Ultrasound images of nanobubbles in xenografts. (A) Ultrasound images of nanobubbles in the three types of xenografts. The red dotted circle represents the xenograft area. (B–D) The time-intensity curves of the nanobubbles in the MCF-7, C33a, and MDA-MB-468 xenografts.
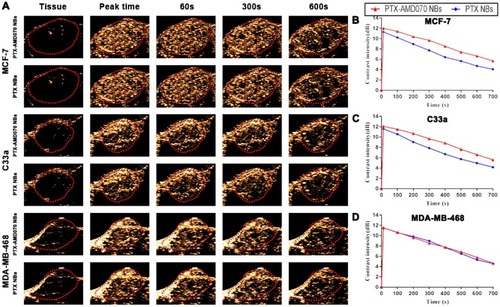
Table 1 Ultrasonic Imaging Parameters Of PTX-AMD070 NBs And PTX NBs In Xenograft Tumors
Figure 8 Distribution of PTX-AMD070 NBs in tissues. Distribution of PTX-AMD070 NBs in MCF-7 xenografts (upper panel), in C33a xenografts (middle and upper panel), in MDA-MB-468 xenografts (middle and lower panel), and in thigh muscle tissue (lower panel). The nuclei are stained blue; the tumor blood vessels are shown in green; the DiI-labeled PTX-AMD070 NBs are red.
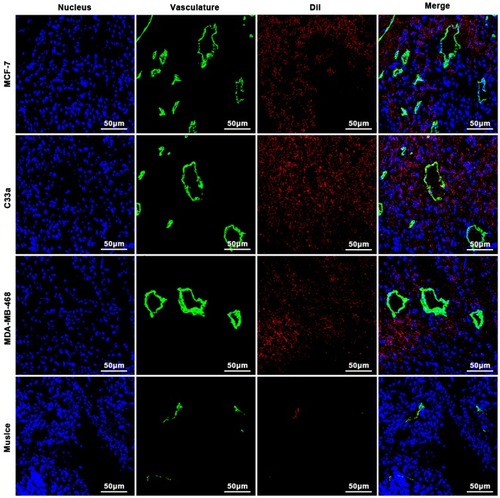
Table 2 Tumor Mass And Tumor Inhibition Rate In Different Treatment Groups
Figure 9 The curative effect in different treatment groups. (A) Xenografts in the tumor-bearing nude mice in different treatment groups. The red circles represent the xenograft areas. Scale, 1 cm. (B) Weight changes of nude mice bearing MCF-7 xenografts in different treatment groups. (C) Weight changes of nude mice bearing C33a xenografts in different treatment groups. (D) Tumor volume changes in nude mice bearing MCF-7 xenografts in different treatment groups. (E) Tumor volume changes in nude mice bearing C33a xenografts in different treatment groups.
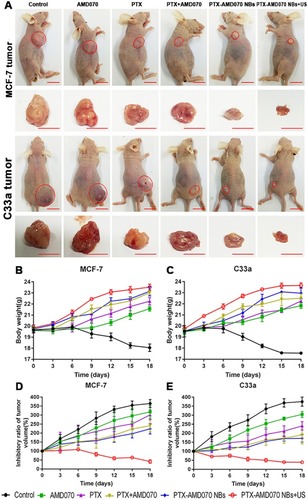
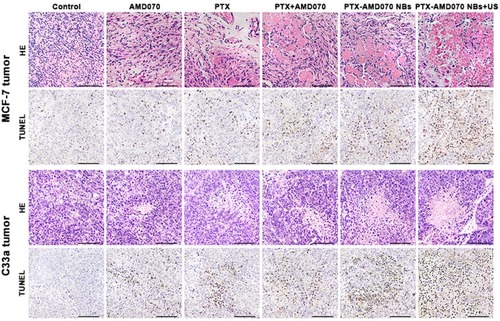
Figure 10 H&E staining and TUNEL staining of xenograft tissues. Scale, 100 μm.