Figures & data
Table 1 The primer sequences of the genes for qRT-PCR
Figure 1 Morphological, physical and chemical properties analysis of nanofiber membranes. Scanning electron microscopic observation of electrospun nanofiber membranes: (A, C, E, G, I) representing PCL, PCL/COL (4:1), PCL/COL (2:1), PCL/COL (1:1), PCL/COL (1:2) respectively, scale bars: 50 µm; (B, D, F, H, J) representing PCL, PCL/COL (4:1), PCL/COL (2:1), PCL/COL (1:1), PCL/COL (1:2) respectively, scale bars: 20 µm. (K) Analysis of the diameters of nanofibers. (L) Porosity measurements using mercury intrusion porosimetry technique. (M) Dissolution rate detection of nanofiber membranes, **p<0.01.
Abbreviations: PCL, polycaprolactone; COL, collagen.
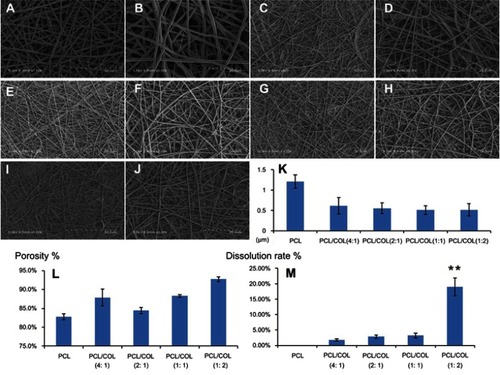
Figure 2 Composition analysis and hydrophilicity detection of nanofiber membranes. Scanning electron microscopic observation of PDA surface coating nanofiber membranes: (A) PDA-coated PCL, (B) PDA-coated PCL/COL (4:1), (C) PDA-coated PCL/COL (2:1), (D) PDA-coated PCL/COL (1:1), (E) PDA-coated PCL/COL (1:2), scale bars: 5 µm. Water contact angles of nanofiber membranes: (F) PCL, (G) PCL/COL (4:1), (H) PCL/COL (2:1), (I) PCL/COL (1:1), (J) PCL/COL (1:2), (K) PDA-coated PCL, (L) PDA-coated PCL/COL (4:1), (M) PDA-coated PCL/COL (2:1), (N) PDA-coated PCL/COL (1:1), (O) PDA-coated PCL/COL (1:2). (P) Statistical analysis of water contact angle values, *p<0.05 compared with PCL group. (Q, R) Fourier-transform infrared analysis of nanofiber membranes.
Abbreviations: PCL, polycaprolactone; COL, collagen; PDA, poly(dopamine).
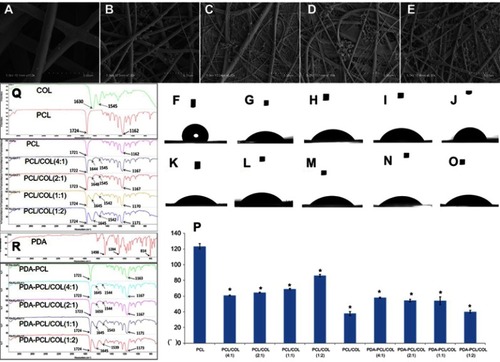
Figure 3 Identification of TSPCs in vitro. (A) General view of colony formation assay. (B) Microscopic observation of single colony colonies with crystal violet staining, magnification: x40. (C) Microscopic observation of P0 cells, magnification: x40. (D) Microscopic observation of P3 cells, magnification: x100. (E–H) Flow cytometry assay of stem cell surface specific markers. Alizarin red staining in the osteogenic induction group (I) and the control group (J), magnification: x100. Oil red O staining in the adipogenic induction group (K) and the control group (L), magnification: x100. Alcian blue staining of the cell pellet in the chondrogenic induction group (M), scale bars: 100 µm. General view of the cell pellet in the chondrogenic induction group (N) and the control group (O).
Abbreviations: TSPCs, tendon stem/progenitor cells.
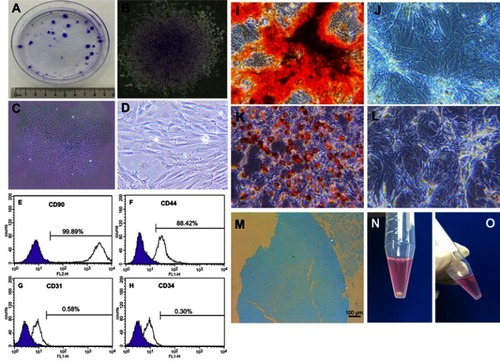
Figure 4 Cell proliferation of TSPCs using cell counting kit-8 assay. a,b,c,ep<0.05 compared with PCL; d,fp<0.05 compared with positive control.
Abbreviations: TSPCs, tendon stem/progenitor cells; PCL, polycaprolactone; COL, collagen; PDA, poly(dopamine).
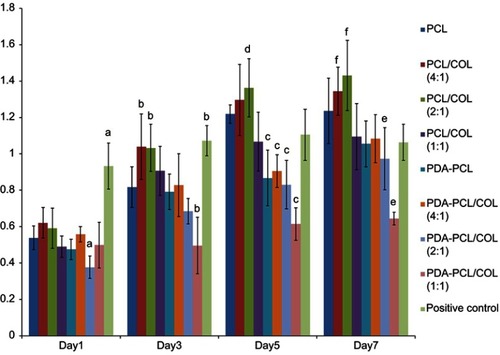
Figure 5 Cell viability of TSPCs in nanofiber membranes using the Live/Dead Viability assay. (A, G, M) TSPCs cultured on PCL for day1, day3, day5. (B, H, N) TSPCs cultured on PCL/COL (4:1) for day1, day3, day5. (C, I, O) TSPCs cultured on PCL/COL (2:1) for day1, day3, day5. (D, J, P) TSPCs cultured on PDA-coated PCL for day1, day3, day5. (E, K, Q) TSPCs cultured on PDA-coated PCL/COL (4:1) for day1, day3, day5. (F, L, R) TSPCs cultured on PDA-coated PCL/COL (2:1) for day1, day3, day5, scale bars: 58 µm.
Abbreviations: TSPCs, tendon stem/progenitor cells; PCL, polycaprolactone; COL, collagen; PDA, poly(dopamine).
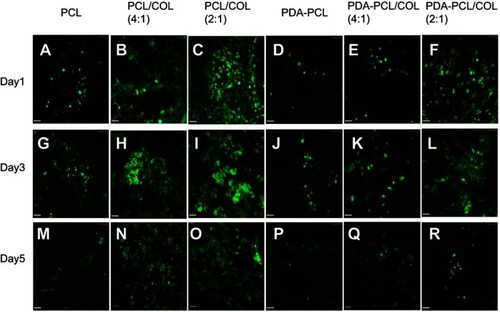
Figure 6 Cell morphology of TSPCs in nanofiber membranes using scanning electron microscopic observation. (A, G, M) TSPCs cultured on PCL for day1, day3, day5. (B, H, N) TSPCs cultured on PCL/COL (4:1) for day1, day3, day5. (C, I, O) TSPCs cultured on PCL/COL (2:1) for day1, day3, day5. (D, J, P) TSPCs cultured on PDA-coated PCL for day1, day3, day5. (E, K, Q) TSPCs cultured on PDA-coated PCL/COL (4:1) for day1, day3, day5. (F, L, R) TSPCs cultured on PDA-coated PCL/COL (2:1) for day1, day3, day5, scale bars: 50 µm.
Abbreviations: TSPCs, tendon stem/progenitor cells; PCL, polycaprolactone; COL, collagen; PDA, poly(dopamine).
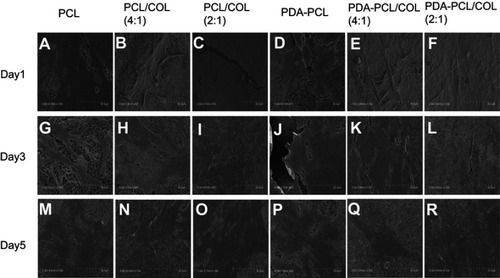
Figure 7 The cytoskeleton morphology of TSPCs using fluorescence microscopy. Fluorescence staining of TSPCs on electrospun nanofibers after 24 h of culture: (A) PCL, (B) PCL/COL (4:1), (C) PCL/COL (2:1), (D) PDA-coated PCL, (E) PDA-coated PCL/COL (4:1), (F) PDA-coated PCL/COL (2:1), scale bars: 50 µm. (G) Projected area per cell, *p<0.05 compared with PCL.
Abbreviations: TSPCs, tendon stem/progenitor cells; PCL, polycaprolactone; COL, collagen; PDA, poly(dopamine).
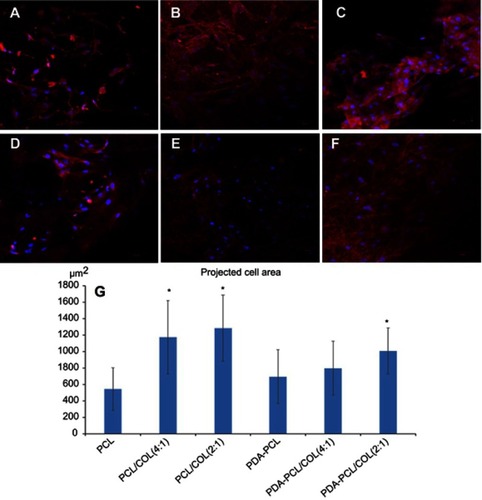
Figure 8 Quantitative real-time reverse transcription polymerase chain reaction (qRT-PCR) for osteogenic differentiation of TSPCs. mRNA expression of Col1a1 in nanofiber membranes for 4 days (A), 7 days (E) and 14 days (I). mRNA expression of Ocn in nanofiber membranes for 4 days (B), 7 days (F) and 14 days (J). mRNA expression of Runx-2 in nanofiber membranes for 4 days (C), 7 days (G) and 14 days (K). mRNA expression of Oct-4 in nanofiber membranes for 4 days (D), 7 days (H) and 14 days (L). *p<0.05 compared with PCL.
Abbreviations: TSPCs, tendon stem/progenitor cells; PCL, polycaprolactone; COL, collagen; PDA, poly(dopamine); Col1a1, collagen I alpha 1; Ocn, osteocalcin.
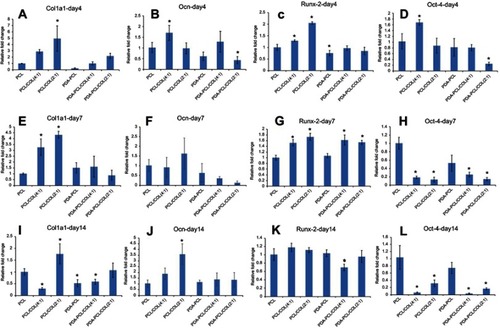
Figure 9 Col1a2 expression using immunofluorescent staining assay. (A, G, M) TSPCs cultured on PCL for day7, day14, day21. (B, H, N) TSPCs cultured on PCL/COL (4:1) for day7, day14, day21. (C, I, O) TSPCs cultured on PCL/COL (2:1) for day7, day14, day21. (D,J,P) TSPCs cultured on PDA-coated PCL for day7, day14, day21. (E, K, Q) TSPCs cultured on PDA-coated PCL/COL (4:1) for day7, day14, day21. (F, L, R) TSPCs cultured on PDA-coated PCL/COL (2:1) for day7, day14, day21, scale bars: 50 µm.
Abbreviations: TSPCs, tendon stem/progenitor cells; PCL, polycaprolactone; COL, collagen; PDA, poly(dopamine); Col1a2, collagen I alpha 2.
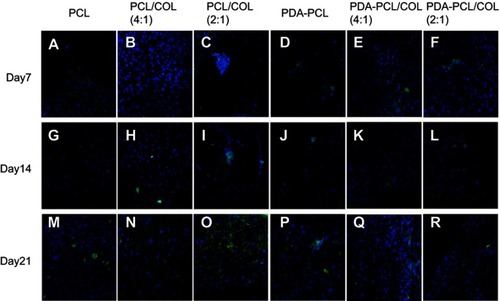
Figure 10 Ocn expression using immunofluorescent staining assay. (A, G, M) TSPCs cultured on PCL for day7, day14, day21. (B, H, N) TSPCs cultured on PCL/COL (4:1) for day7, day14, day21. (C, I, O) TSPCs cultured on PCL/COL (2:1) for day7, day14, day21. (D, J, P) TSPCs cultured on PDA-coated PCL for day7, day14, day21. (E, K, Q) TSPCs cultured on PDA-coated PCL/COL (4:1) for day7, day14, day21. (F, L, R) TSPCs cultured on PDA-coated PCL/COL (2:1) for day7, day14, day21, scale bars: 50 µm.
Abbreviations: TSPCs, tendon stem/progenitor cells; PCL, polycaprolactone; COL, collagen; PDA, poly(dopamine); Ocn, osteocalcin.
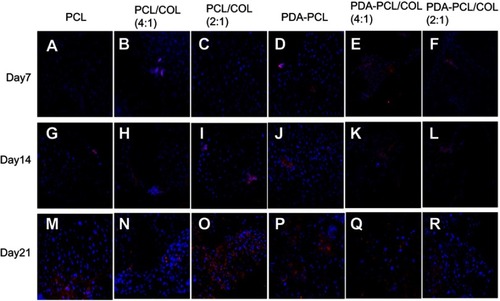
Figure 11 Runx-2 expression using immunofluorescent staining assay. (A, G, M) TSPCs cultured on PCL for day7, day14, day21. (B, H, N) TSPCs cultured on PCL/COL (4:1) for day7, day14, day21. (C, I, O) TSPCs cultured on PCL/COL (2:1) for day7, day14, day21. (D, J, P) TSPCs cultured on PDA-coated PCL for day7, day14, day21. (E, K, Q) TSPCs cultured on PDA-coated PCL/COL (4:1) for day7, day14, day21. (F, L, R) TSPCs cultured on PDA-coated PCL/COL (2:1) for day7, day14, day21, scale bars: 50 µm.
Abbreviations: TSPCs, tendon stem/progenitor cells; PCL, polycaprolactone; COL, collagen; PDA, poly(dopamine).
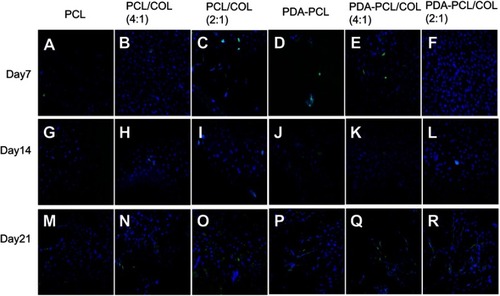
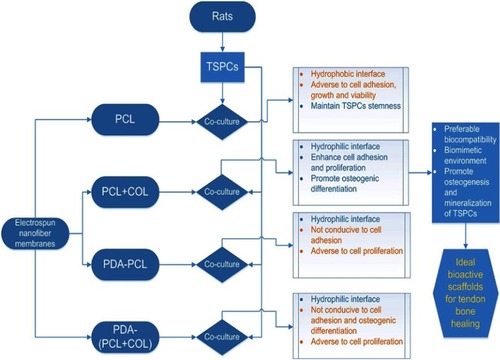
Figure 12 Schematic diagram of the regulation of electrospun nanofiber membranes on TSPCs.
Abbreviations: TSPCs, tendon stem/progenitor cells; PCL, polycaprolactone; COL, collagen; PDA, poly(dopamine).