Figures & data
Table 1 The Hydrodynamic Sizes Of Platinum Nanoparticles (ptnps) Dispersed In Water And 10% Fetal Bovine Serum (FBS)-Supplemented Dulbecco’s Modified Eagle Medium (DMEM)
Figure 1 Transmission electron microscopy (TEM) images of platinum nanoparticles (PtNPs): (A) Pt-5nm; (B) Pt-30nm; (C) Pt-70nm.
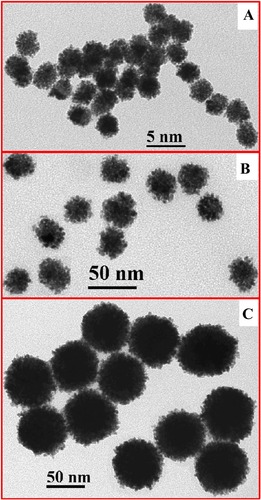
Figure 2 The DSS-induced clinical symptoms: (A) body weight kinetics; (B) Disease Activity Index (DAI); (C) statistical analysis and (D) representative images of colon length; (E) typical images and (F) histopathological scores of colonic tissues. Data in (A) and (B) are presented as mean ± standard deviations with significant differences versus the DSS control represented by asterisks (**P < 0.01, *P < 0.05, two-paired Student’s t-test). Each point in (C) and (F) represents the result of one animal, with significance labeled by different lower-case letters (P < 0.05, one-way analysis of variance with Turkey’s honest significant difference test).
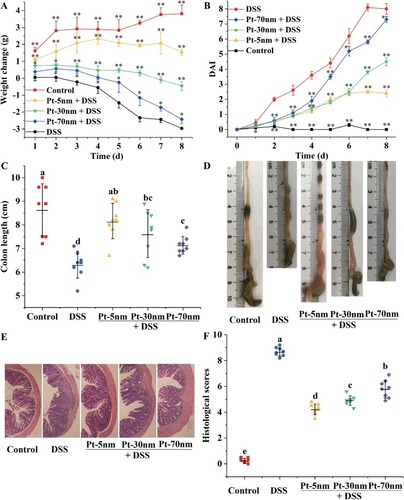
Figure 3 Immunological analysis of tight junction proteins and Hsp25 expressed in colon: (A) images and (B) densitometry of Western blotting analysis; (C) immunolocalization of tight junction proteins by immunofluorescence microscopy (200×). Blots in (A) are representative of at least 5 animals in each group, and experiments were performed for 3 times. Densitometry results in (B) are given in relation to normal controls that were set to be 1.0. Significance is labeled by different lower-case letters (P < 0.05, one-way analysis of variance with Turkey’s honest significant difference test).
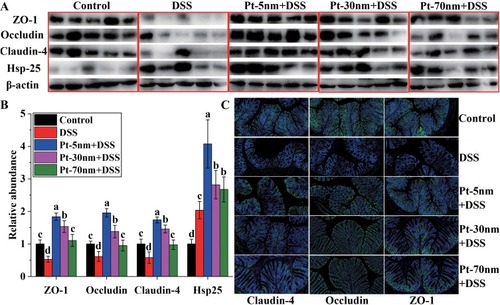
Figure 4 Biochemical parameters of acute colitis: (A) colonic MPO activity; the colonic levels of (B) IL-6 and (C) TNF-α; the serum concentrations of (D) IL-6 and (E) TNF-α. Each point represents the result of one animal, with significance labeled by different lower-case letters (P < 0.05, one-way analysis of variance with Turkey’s honest significant difference test).
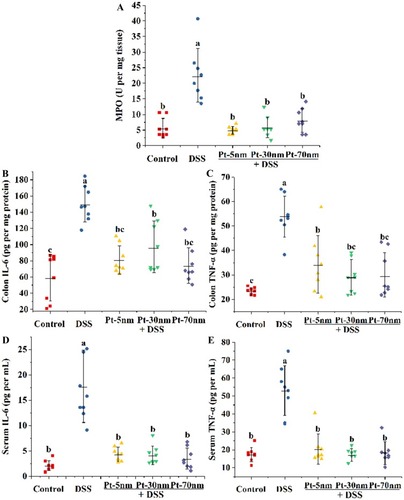
Figure 5 The peripheral hematological parameters: (A) white blood cells, (B) lymphocytes, (C) monocytes and (D) hemoglobin. Each point represents the result of one animal, with significance labeled by different lower-case letters (P < 0.05, one-way analysis of variance with Turkey’s honest significant difference test).
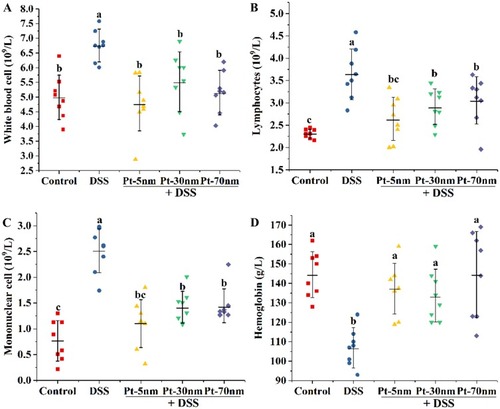
Figure 6 The anti-inflammatory effects of PtNPs in LPS-activated RAW264.7 cells: (A) cell viability (n = 6), with significance labeled by *P < 0.05 and **P < 0.01; production of (B) nitric oxide (n = 6), (C) interleukin-6 (IL-6) (n = 3), (D) tumor necrosis factor-α (TNF-α) (n = 3) and (E) dichlorodihydrofluorescein (DCF) fluorescence (n = 6), with significance labeled by different lower-case letters. Data were expressed as mean ± standard deviations, and were compared by one-way analysis of variance with Turkey’s honest significant difference test.
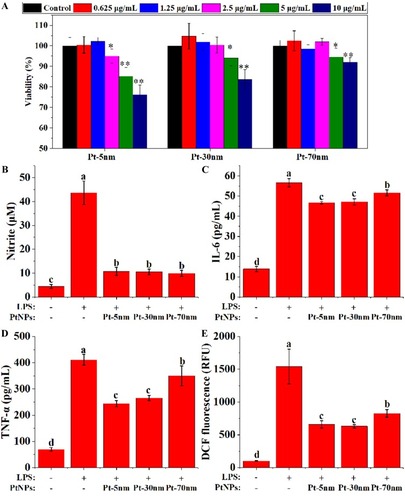
Figure 7 Analysis of the cell lysate levels of (A) nuclear factor kappa B (NF-κB) p65, (B) nitric oxide synthase (iNOS), and (C) Toll-like receptor 4 (TLR4) by Western blotting, and (D) the cell surface TLR4 by flow cytometry in RAW264.7 cells. Blots are representative of at least 3 replicates, and experiments were performed in triplicate. Immunoblots for actin were performed for each membrane to normalize protein loading between samples. Densitometry results are given in relation to normal controls that were set to be 1.0, with significance labeled by different lower-case letters (P < 0.05, one-way analysis of variance with Turkey’s honest significant difference test).
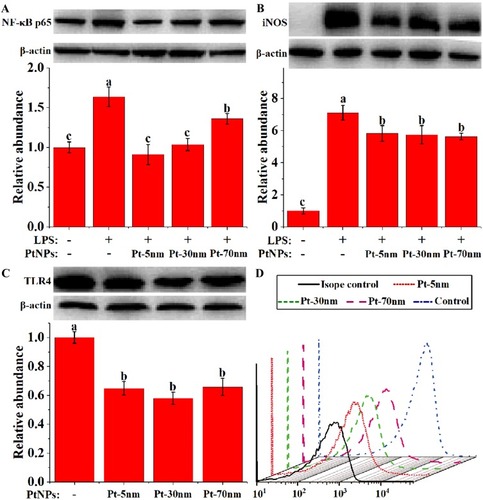
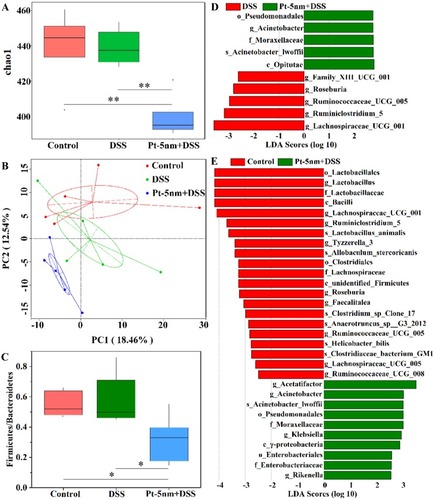
Figure 8 The effects of PtNPs on gut-microbiota profile: (A) the Chao1 metric for α-diversity; (B) unweighted principal component analysis of β-diversity, with each point representing the result of one animal and the percentages indicating contribution of the principal components to sample difference; (C) the ratios of Firmicutes to Bacteroidetes; (D and E) linear discriminant analysis (LDA) scores of the differentially abundant taxa as identified by LDA effect size. The comparison in (A), (C), (D) and (E) was made by Wilcox’s test with significance labeled by **P < 0.01 or *P < 0.05.