
Figures & data
Figure 1 Schematic of the study: the process of preparing the SV/CS/PET-HA ligaments, in vitro osteogenic differentiation and in vivo rat model.
Abbreviations: PET, polyethylene terephthalate; HA, hydroxyapatite; CS, chitosan; SV, simvastatin.
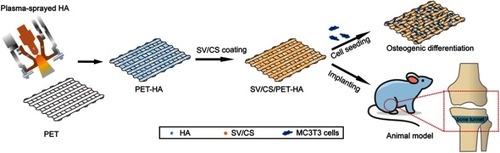
Table 1 Primer sequences used for qPCR assay
Figure 2 Characterizations of control PET (A1-2), nontreated PET-HA (B1-2), CS/PET-HA (C1-2) and SV/CS/PET-HA (D1-2). Diameter distribution of HA nanoparticles in nontreated PET-HA (E) and distribution of nanopore size of the SV/CS/PET-HA sheet (F).
Abbreviations: CS, chitosan; SV, simvastatin; HA, hydroxyapatite; PET, polyethylene terephthalate; FESEM, Field Emission Scanning Electron Microscope.
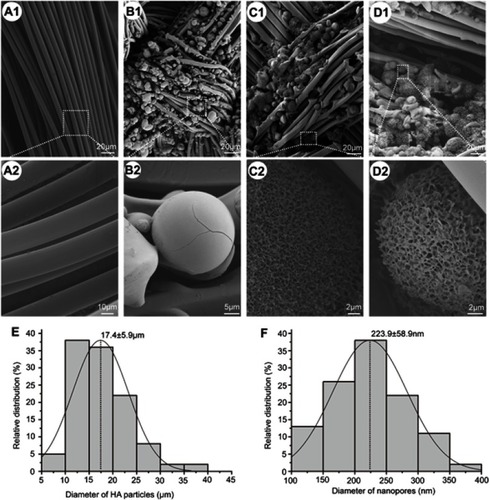
Figure 3 Drug release and CCK-8 assay. (A) In vitro cumulative release profile of SV. (B) Results of the CCK-8 cell proliferation assay of MC3T3-E1 preosteoblast cells cocultured with PET-HA, CS/PET-HA and SV/CS/PET-HA sheets after 1, 2, 4 and 7 days.
Notes: *p<0.05; **p<0.01, compared with that of PET-HA.
Abbreviations: CS, chitosan; SV, simvastatin; HA, hydroxyapatite; PET, polyethylene terephthalate.
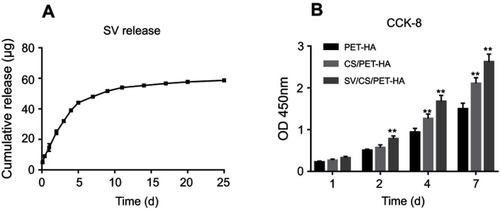
Figure 4 mRNA expression levels of osteogenic-related genes. qPCR analysis was performed for COL-1 (A, E), BMP-2 (B, F), OCN (C, G) and ALP (D, H) on the 4th and 7th days.
Notes: *p<0.05; **p<0.01, compared with that of PET-HA.
Abbreviations: CS, chitosan; SV, simvastatin; HA, hydroxyapatite; PET, polyethylene terephthalate; COL-1, collegen-1; BMP-2, bone morphogenetic protein-2; OCN, osteocalcin, ALP, alkaline phosphatase.
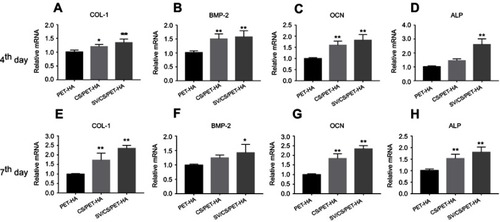
Figure 5 Extra-articular traverse bone tunnel model. (A) A PET ligament passing through the tibia bone tunnel. Representative reconstructed 2D micro-CT images of the bone tunnel at the 6th week in the sagittal (B), coronal (C), and transverse (D) planes.
Notes: The red region contoured the PET ligament in bone tunnel.
Abbreviations: PET, polyethylene terephthalate; PT, patellar tendon; Sag, sagittal; Cor, coronal; Tra, transverse.
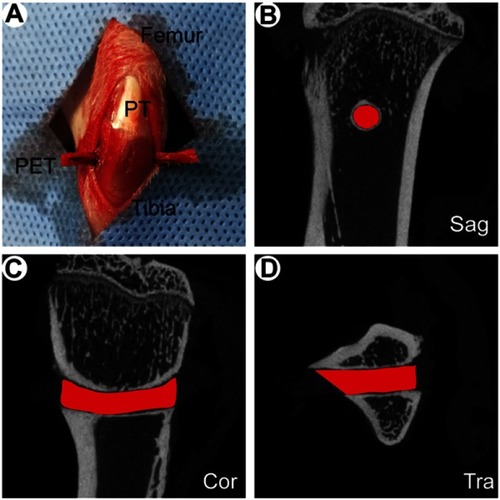
Figure 6 Representative reconstructed 3D micro-CT images of the bone-implant integration at the 3rd (A1, B1, C1) and 6th (A2, B2, C2) weeks after surgery. Quantitative analysis of the parameters (BMD, BV/TV, and BS/BV) of peri-implant bone at the 3rd (D1, E1, F1) and 6th (D2, E2, F2) weeks.
Notes: *p<0.05; **p<0.01, compared with that of PET-HA.
Abbreviations: CS, chitosan; SV, simvastatin; HA, hydroxyapatite; PET, polyethylene terephthalate; BMD, bone mineral density; BV/TV, bone volume per total volume; BS/BV, bone surface per bone volume.
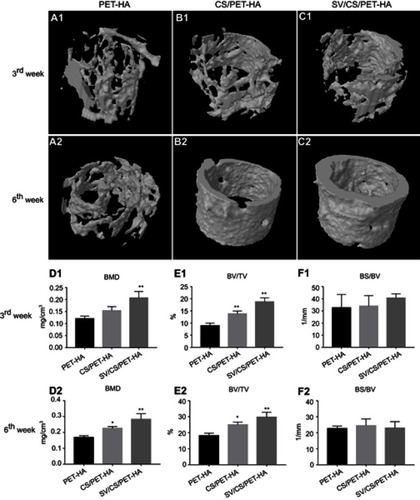
Figure 7 Images of the histological sections and quantitative analysis of the BIC and interface area of bone formation around the implants at the 3rd and 6th weeks after surgery. (A1, C1, E1) HE staining and (A2, C2, E2) Masson’s trichrome staining of corresponding sections showed the bone-implant interface at the 3rd week after surgery. (B1, D1, F1) HE staining and (B2, D2, F2) Masson’s trichrome staining of the corresponding sections showed the bone-implant interface at the 6th week after surgery. Quantitative analysis of the BIC (G, I) and interface area (H, J).
Notes: The yellow dotted lines contoured the interface area. The original magnification is ×5 for A1-F2, and the bar is 500 μm. *p<0.05; **p<0.01, compared with that of PET-HA.
Abbreviations: CS, chitosan; SV, simvastatin; HA, hydroxyapatite; PET, polyethylene terephthalate; BIC, bone interface contact.
