Figures & data
Table 1 Primers for RT-PCR used to quantify the expression of RAW264.7
Figure 1 Characterization of Ti particles.
Notes: (A) and (B) Representative TEM image of Ti particles. (C) Ti particles size distribution, particles with sizes of 52.59±20.48 nm (mean ± SD). Scale bar =100 μm.
Abbreviations: Ti, titanium; TEM, transmission electron microscopy; SD, standard deviation.
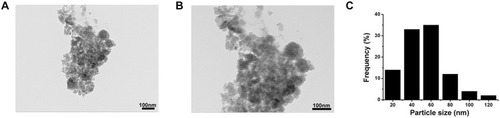
Figure 2 Cell morphology and proliferation.
Notes: (A) Morphology of RAW macrophages obtained by a light microscope. Scale bar: 50 μm. (B) and (C) Cell proliferation was evaluated by CCK-8 after 1 and 4 days of culture.
Abbreviation: CCK-8, cell counting kit-8.
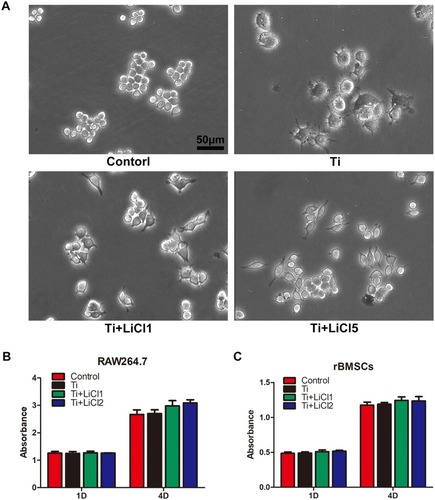
Figure 3 Immunofluorescence staining of RAW cells.
Notes: CCR7 (green fluorophore) indicates M1 macrophages; Arg-1 (red fluorophore) indicates M2 macrophages; nuclei are stained with DAPI (blue fluorophore), scale bar: 50 μm.
Abbreviations: CCR7, C-C chemokine receptor type 7; Arg-1, arginase-1; DAPI, 4ʹ,6-diamidino-2-phenylindole.
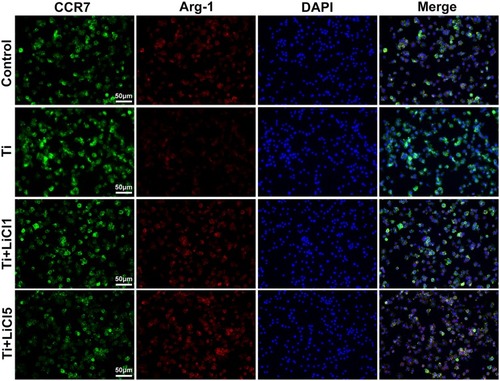
Figure 4 In vitro polarization of macrophage.
Notes: (A) and (B) Representative histograms of flow cytometry results after cultured for 4 days, percentage of CCR7 and CD206 positive cells, representing M1 or M2 macrophages, respectively. (C) Flow cytometry analysis of RAW264.7 cells. (D) and (E) Percentage of CCR7 and CD206 positive cells respectively. (*# and + represent P<0.05 when compared with Control, Ti, and Ti+LiCl1 respectively).
Abbreviations: CCR7, C-C chemokine receptor type 7; CD206, cluster of differentiation 206.
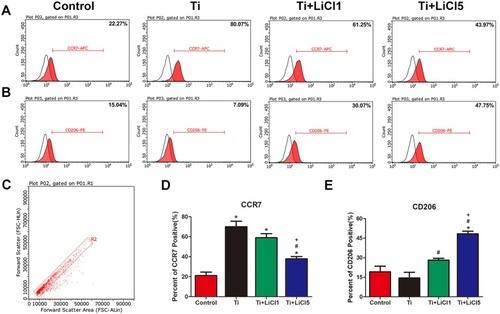
Figure 5 ELISA determination of cytokine, RT-PCR analysis of genes from RAW cells.
Notes: (A) TNF-α, (B) IL-6, (C) IL-4, (D) IL-10, (E) Gene expression of M1 marker CD86, (F) Gene expression of M2 marker CD163, (G) BMP-2 and (H) VEGF. (*# and + represent P<0.05 when compared with Control, Ti, and Ti+LiCl1 respectively).
Abbreviations: ELISA, enzyme-linked immunosorbent assay; RT-PCR, real-time polymerase chain reaction; TNF-α, tumor necrosis factor alpha; IL, interleukin; CD, cluster of differentiation; BMP-2, bone morphogenetic protein-2; VEGF, vascular endothelial growth factor.
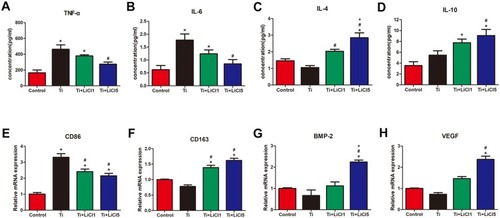
Figure 6 LiCl attenuates Ti particle-induced the activation of ERK and p38 phosphorylation in RAW cells.
Notes: (A) Western blots performed after macrophages were treated with various concentrations (0, 10, 50, 100μg/mL) of Ti particles for the indicated times. (B) and (C) The density of Western blot bands shown in (A) was quantified using ImageJ software. (D) Western blots performed after macrophages were treated with PBS (control), Ti particles or Ti particles+LiCl. (E) and (F) The density of Western blot bands shown in (D) was quantified using ImageJ software. (*# and + represent P<0.05 when compared with Control, Ti, and Ti+LiCl1 respectively).
Abbreviations: LiCl, lithium chloride; Ti, titanium; ERK, extracellular signal-regulated kinase.
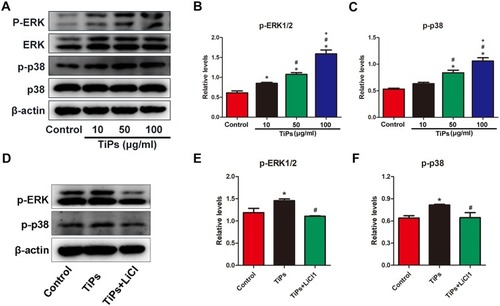
Figure 7 Osteogenic differentiation effect of macrophage-conditioned medium.
Notes: (A) ALP staining and (B) ARS staining of rBMSCs cultured in conditioned medium for 14 days. (C) ALP activity of rBMSCs cultured in conditioned medium for 14 days. (D) Quantitative analysis of Alizarin red staining. (E) ALP immunofluorescent staining of rBMSCs cultured in conditioned medium: ALP (green), actin (red), nuclear (blue). scale bar: 50 μm. (*# and + represent P<0.05 when compared with Control, Ti, and Ti+LiCl1 respectively).
Abbreviations: ALP, Alkaline phosphatase; ARS, alizarin red staining; rBMSCs, rat bone marrow mesenchymal stem cells.
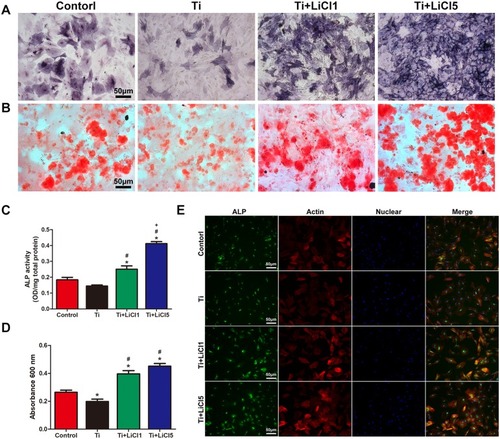
Figure 8 Images of hematoxylin eosin and Masson trichrome staining on the air pouch tissues at day 4.
Notes: (A) hematoxylin eosin stained images showing a whole structure and layers of the air-pouch tissues. (B) Thickness of fibrous layer. (C) Numbers of infiltration cells. (D) Masson’s trichrome stained images obviously displaying the fibrous tissues and the infiltration cells. Cytokines in the air-pouch exudates were evaluated by ELISA: (E) TNF-α; (F) IL-6; (G) IL-4; and (H) IL-10. scale bar: 200 μm. (*# and + represent P<0.05 when compared with Control, Ti, and Ti+LiCl1 respectively).
Abbreviations: ELISA, enzyme-linked immunosorbent assay; TNF-α, tumor necrosis factor alpha; IL, interleukin.
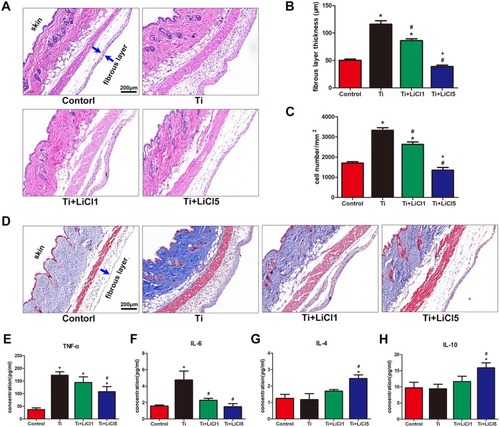
Figure 9 Images of immunofluorescence staining on air-pouch tissues at day 4.
Notes: CCR7 (M1 marker) positive cells were stained in green and Arg-1 (M2 marker) positive cells were stained in red; nuclei were stained in blue; scale bar: 100 μm.
Abbreviations: CCR7, C-C chemokine receptor type 7; Arg-1, arginase-1.
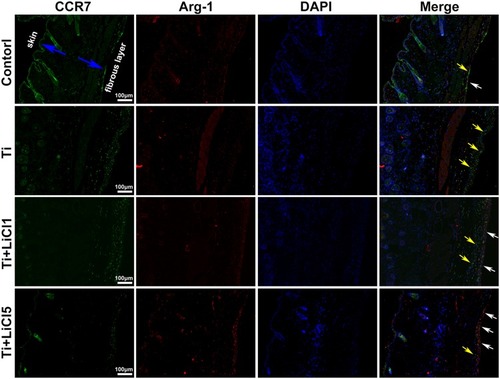
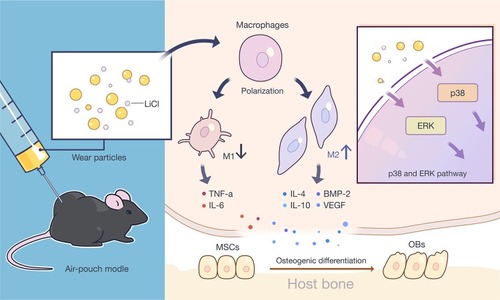
Figure 10 LiCl modulated macrophage polarization to promote the osteogenic differentiation of rBMSCs via the suppression of ERK and p38 phosphorylation.
Notes: LiCl exerted an immunomodulatory effect on macrophage polarization and attenuated Ti particle-induced inflammatory responses in vitro and in vivo, and generated an immune microenvironment to improve the osteogenic differentiation capability of rBMSCs. This immunomodulatory capacity of LiCl may be attributed to the inhibition of ERK and p38 signaling pathway.
Abbreviations: LiCl, lithium chloride; rBMSCs, rat bone marrow mesenchymal stem cells; ERK, extracellular signal-regulated kinase; Ti, titanium.