Figures & data
Table 1 The influence of different surfactants on the particle size, PI, and zeta potential of paclitaxel nanosuspension
Table 2 The influence of different surfactants on the stability of paclitaxel nanosuspension
Table 3 The influence of combinatorial surfactants on the size, PI, and zeta potential of paclitaxel nanosuspension
Figure 1 The influence of different ratios of poloxamer 188 and PEG-400 on the particle size.
Abbreviation: PEG-400, polyethylene glycol 400.
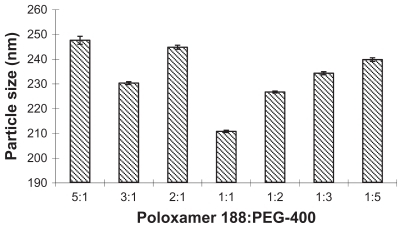
Figure 2 The influence of different ratios of surfactant and paclitaxel on the size of nanoparticles.
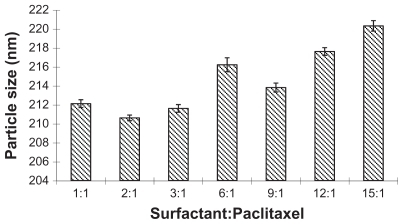
Figure 3 The influence of homogenization pressure and cycle number on the particle size of nanosuspension.
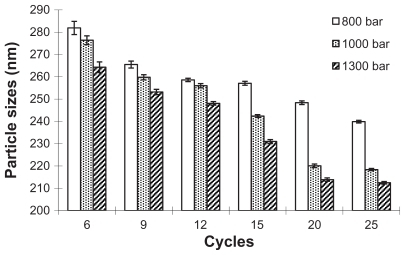
Figure 4 The influence of homogenization pressure and cycle number on the PI of nanoparticles (standard deviation values are not reported).
Abbreviation: PI, polydispersity index.
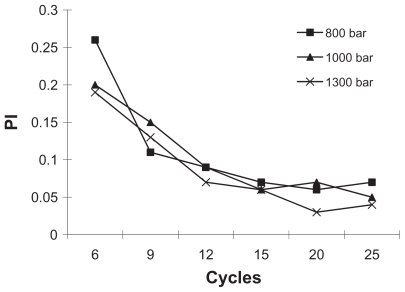
Figure 5 Transmission electron microscopy of paclitaxel nanosuspension. Magnification: 10,000×.
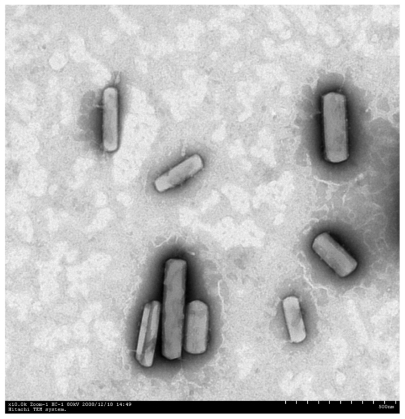
Figure 6 Differential scanning capacity thermography. (A) Raw material of paclitaxel. (B) Paclitaxel nanosuspension.

Figure 7 Dissolution profiles of paclitaxel from PTX-NO and PTX-INJ into mice at a dose of 10 mg paclitaxel/kg.
Note: Data are mean ± standard deviation, n = 3.
Abbreviations: PTX-INJ, paclitaxel injection; PTX-NO, paclitaxel nanosuspension.
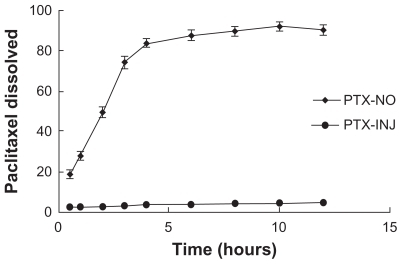
Table 4 Pharmacokinetic parameters in rats after intravenous injection of PTX-NO and PTX-INJ (n = 6)
Figure 8 The curves of the mean plasma drug concentration versus time in rats after intravenous injection of PTX-NO and PTX-INJ.
Note: Data are mean ± standard deviation, n = 3.
Abbreviations: PTX-INJ, paclitaxel injection; PTX-NO, paclitaxel nanosuspension.
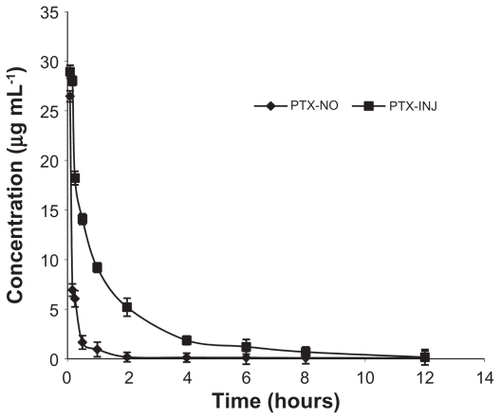
Table 5 AUC values in various tissues after intravenous injection of PTX-NO and PTX-INJ into the mice
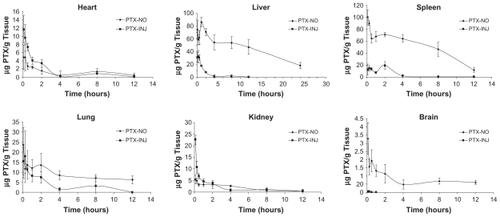
Figure 9 Tissue distribution curves of PTX-NO and PTX-INJ after 10 mg paclitaxel/kg intravenous injection in mice.
Note: Data are mean ± standard deviation, n = 3.
Abbreviations: PTX-INJ, paclitaxel injection; PTX-NO, paclitaxel nanosuspension.