
Figures & data
Table 1 Composition, Yield, And Drug Content Of Spray-Dried Rifampicin Nanocomposites
Figure 1 Scanning electron microscope (SEM) micrograph of raw rifampicin (A), spray-dried nanosuspension (B) and selected spray-dried rifampicin nanocomposites powders F1 (C), F4 (D), F2 (E), F5 (F), F7 (G) and F7 at higher magnification (H).
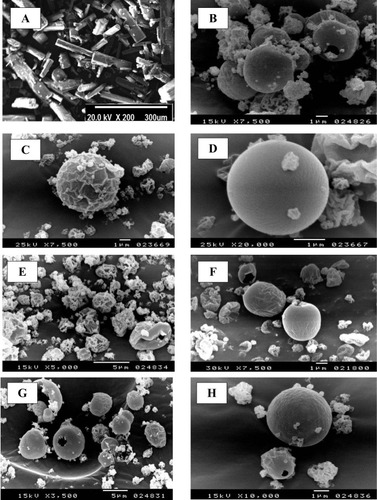
Table 2 Particle Size Distribution And Surface Area Of Spray-Dried Rifampicin Nanocomposites
Table 3 Physiochemical Characteristics Of Reconstituted Spray-Dried Rifampicin Nanocomposites
Table 4 Flow Features Of Spray-Dried Rifampicin Nanocomposites
Figure 2 In-vitro dissolution profiles of different spray-dried rifampicin nanocomposites powders and crude rifampicin in PBS pH 7.4 at 37±2°C (mean±SD n=3).
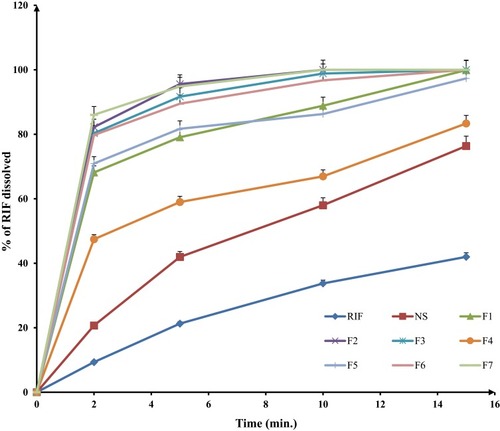
Figure 3 In-vitro dissolution parameters; dissolution efficiency, %DE at 10 min and mean dissolution time, MDT of spray-dried rifampicin nanocomposites prepared with different matrix formers and raw rifampicin powder (mean±SD n=3).
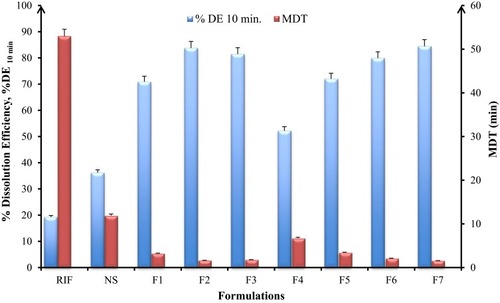
Table 5 Aerosol Dispersion Performance Parameters Of Spray-Dried Rifampicin Nanocomposites
Figure 4 Effect of the flow properties on the inhalation indices of spray-dried rifampicin nanocomposites, namely emitted fraction (%EF) and respirable fraction (%RF), mean±SD (n=3).
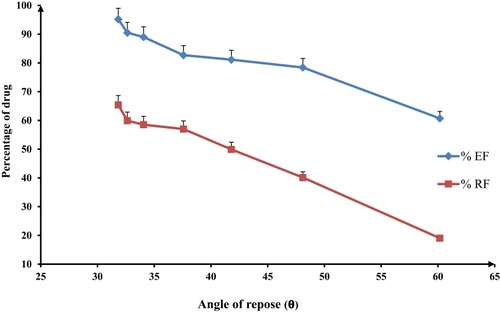
Figure 5 In-vitro deposition data of rifampicin-loaded spray-dried nanocomposites powders determined using a twin stage impinger. Aerolizer® (DPI) was used to deliver the dose into the various parts of the TSI operated at a flow rate of 60 L/min, mean±SD (n=3).
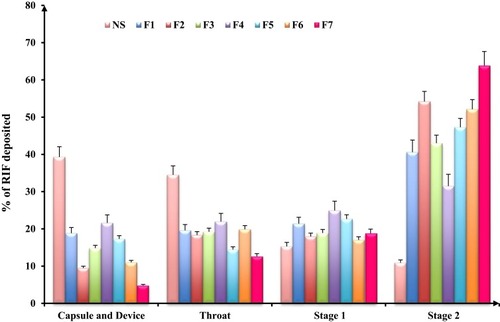
Figure 6 DSC thermograms of rifampicin-loaded spray-dried nanocomposites powder with its individual components, rifampicin (A), maltodextrin (B), leucine (C), mannitol (D), physical mixture (E) and formula F7 (F).
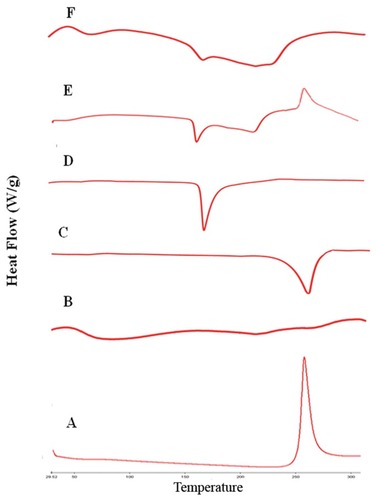
Figure 7 FTIR spectra of rifampicin-loaded spray-dried nanocomposites powder (F7) with its individual components, rifampicin (A), physical mixture (B), mannitol (C), maltodextrin (D), leucine (E) and formula F7 (F).
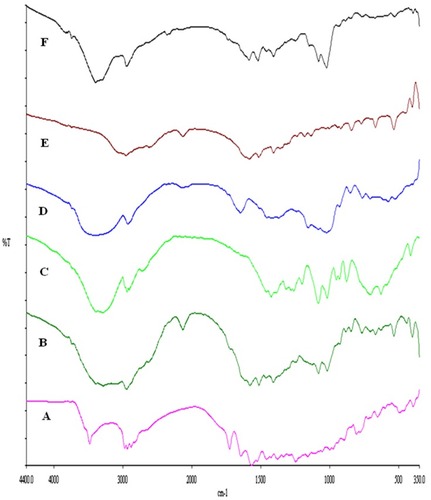
Figure 8 X-ray powder diffraction patterns of rifampicin (A), leucine (B), mannitol (C), maltodextrin (D), spray-dried rifampicin nanosuspensions (NS) (E), physical mixture (F) and spray-dried RIF nanocomposites (F7) (G).
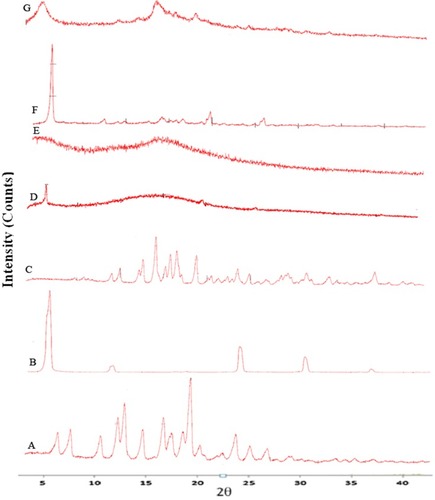
Figure 9 Percentage of viability of A549 cells measured by the MTT cytotoxicity assay after exposure for 24 hrs to various concentrations of free rifampicin, rifampicin nanosuspensions and spray-dried rifampicin nanocomposites (F2, F5, F6, F7) at 37±0.5°C, mean±SD (n=3).
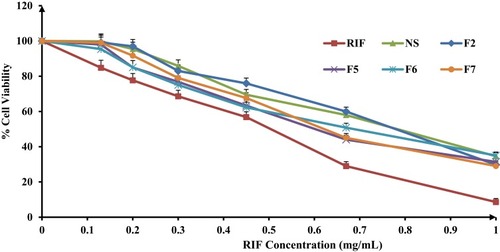
Table 6 Stability Study Of Spray-Dried Rifampicin Nanocomposites (F7) Stored At Room Temperature (25±2°C) For 6 Months