Figures & data
Figure 1 Synthesis scheme of poly(ester amine) from L-lactide and polyethylenimine.
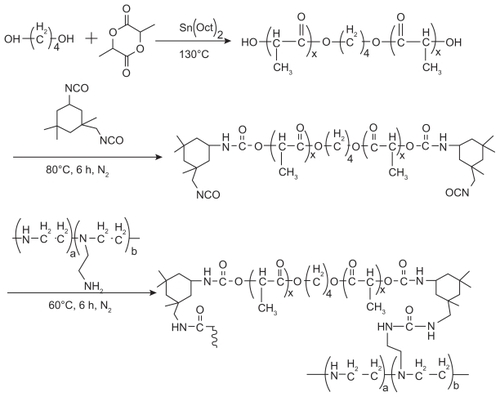
Figure 2 Representative 1H-nuclear magnetic resonance spectrum (400 mHz) of PLLA copolymer in CDCl3.
Note: In the H-nuclear magnetic resonance spectra, the chemical shifts of the TMS (Si(CH3)4), as relative standard, were defined zero.
Abbreviation: PLLA, poly(L-lactide).
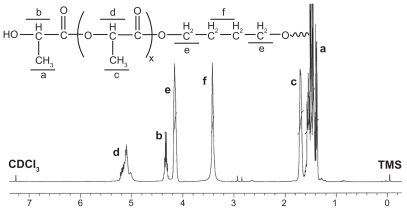
Figure 3 Representative 1H-nuclear magnetic resonance spectrum (400 mHz) of poly(ester amine) copolymer in D2O.
Note: In the H-nuclear magnetic resonance spectra, the chemical shifts of the TMS (Si(CH3)4), as relative standard, were defined zero.
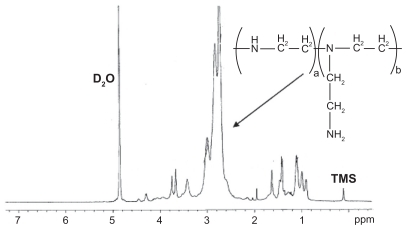
Figure 4 Fourier transform infrared absorption spectra of (A) PLLA, (B) isophorone di-isocyanate-PLLA-isophorone di-isocyanate, and (C) poly(ester amine) copolymer.
Abbreviation: PLLA, poly(L-lactide).
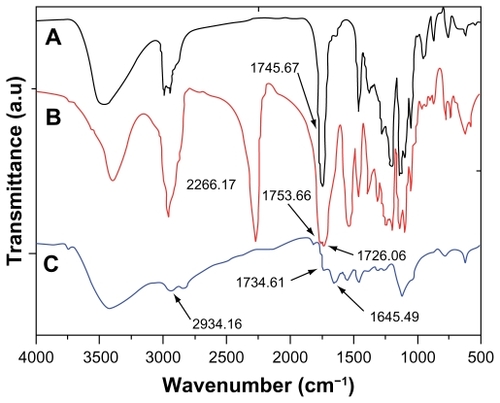
Figure 5 Possible structure of complexes formed from plasmid DNA condensation using PLLA-polyethylenimine (poly[ester amine]) copolymers.
Abbreviations: PLLA, poly(L-lactide); PEI, polyethylenimine; PEA, poly(ester amine).
![Figure 5 Possible structure of complexes formed from plasmid DNA condensation using PLLA-polyethylenimine (poly[ester amine]) copolymers.Abbreviations: PLLA, poly(L-lactide); PEI, polyethylenimine; PEA, poly(ester amine).](/cms/asset/cdd9235f-9922-4bcc-87da-ffa67063df66/dijn_a_21141_f0005_c.jpg)
Figure 6 Agarose gel electrophoresis of poly(ester amine) (PeA)/DNA complexes at various weight ratios.
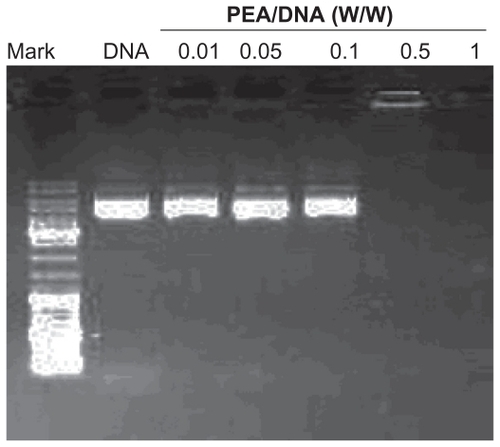
Figure 7 Particle sizes and zeta potentials of poly(ester amine) (PEA)/DNA complexes at various weight ratios.
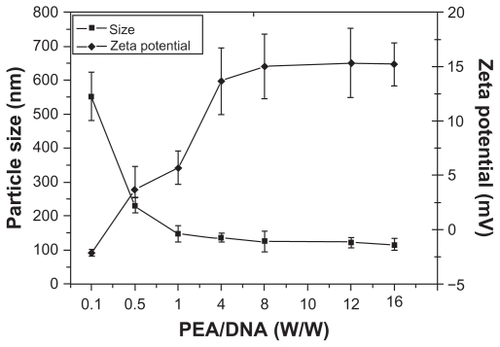
Figure 8 Cytotoxicity of poly(ester amine) (PEA) and polyethylenimine (PEI) (25 kDa) at various weight ratios in HEK293 and HepG-2 cell lines.
Notes: Cells were seeded in 96-well plates at an initial density of 5 × 10⁵ cells/well in 0.2 mL of growth media; cell viability were detected by MTT assay (mean ± standard deviation, n = 6); significance were assessed compared with the polyethylenimine (25 kDa) control for each time point assayed; *P < 0.05.
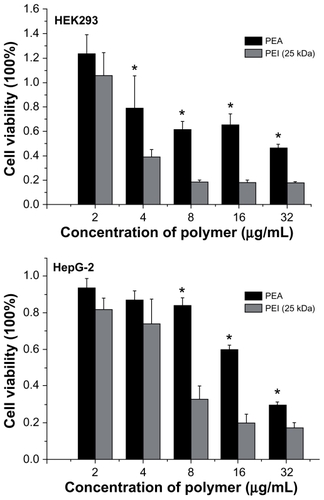
Figure 9 Flow cytometry graphs typical of the transfection efficiency in HEK293 cells were incubated with poly(ester amine)/DNA complexes at different weight ratios for 24 hours, polyethylenimine (25 kDa) and an optimized carrier to gene weight ratio of 1.5 as the control.
Note: P < 0.05.
Abbreviations: PEI, polyethylenimine; PEA, poly(ester amine); PMT, photo multiplier tube.
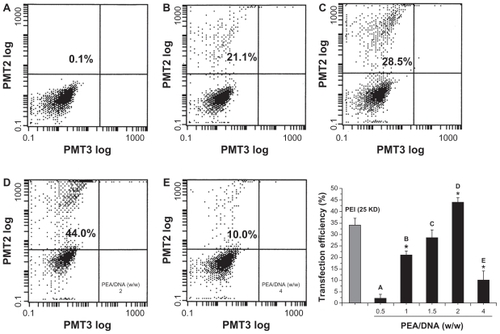
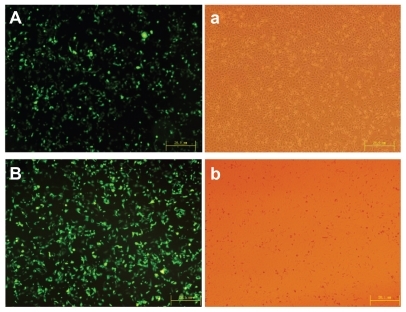
Figure 10 High transfection efficiency images of (A) polyethylenimine (25 kDa) and (B) poly(ester amine)/DNA were shown in cell lines HEK293.
Notes: Cells were incubated with polyethylenimine (25 kDa)/DNA and poly(ester amine)/DNA complexes at carrier to gene weight ratios of 2 and 1.5 for 24 hours; green fluorescent protein expression was observed under fluorescent microscopy.