Figures & data
Figure 1 Effect of dendrimers (PAMAM) on collagen biosynthesis in keratinocytes and fibroblasts. The cells were subjected to various concentrations of dendrimers (0.3 mg/mL, 1.5 mg/mL and 3.0 mg/mL) for 24 h. Values represent the mean (% of the control) ± SD of six experiments. The asterisk (*) indicates statistically significant differences compared with the untreated control. ***p<0.001 vs the control group.
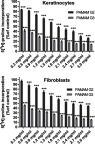
Figure 2 Flow cytometric analysis of population keratinocyte and fibroblast cells treated for 24 h with 2nd and 3rd generation PAMAM dendrimers (0.3 mg/mL, 1.5 mg/mL and 3.0 mg/mL) for IL-1β. Mean percentage values from three independent experiments (n=6) done in duplicate are presented. *p<0.05 vs the control group, **p<0.01 vs the control group, ***p<0.001 vs the control group.
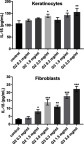
Figure 3 Flow cytometric analysis of population keratinocyte and fibroblast cells treated for 24 h with 2nd and 3rd generation PAMAM dendrimers (0.3 mg/mL, 1.5 mg/mL and 3.0 mg/mL) for IL-6. Mean percentage values from three independent experiments (n=6) done in duplicate are presented. *p<0.05 vs the control group, **p<0.01 vs the control group, ***p<0.001 vs the control group.
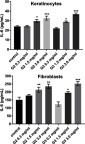
Figure 4 Flow cytometric analysis of populations keratinocyte and fibroblast cells treated for 24 h with 2nd and 3rd generation PAMAM dendrimers (0.3 mg/mL, 1.5 mg/mL and 3.0 mg/mL) for IL-8. Mean percentage values from three independent experiments (n=6) done in duplicate are presented. *p<0.05 vs the control group, **p<0.01 vs the control group, ***p<0.001 vs the control group.
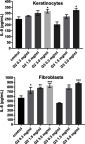
Figure 5 Morphological changes in keratinocyte and fibroblast cells incubated with different concentrations (0.3 mg/mL, 1.5 mg/mL and 3.0 mg/mL) of 2nd and 3rd generation PAMAM dendrimers for 24 h exposure. Representative photographs are shown. Morphological effects evaluated by phase contrast microscopy (magnification × 100).
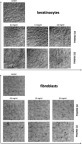
Figure 6 Fluorescence of keratinocyte and fibroblast cells treated for 24 h with 2nd and 3rd generation PAMAM dendrimers (0.3 mg/mL, 1.5 mg/mL and 3.0 mg/mL) incubated with mitochondrial membrane potential probe JC-1. The x- and y-axes are green and red fluorescence, respectively. Mean percentage values from three independent experiments (n=3) done in duplicate are presented. *p<0.05 versus the control group, **p<0.01 vs the control group.
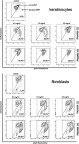
Figure 7 Flow cytometric analysis of keratinocyte and fibroblast cancer cells after incubation with 2nd and 3rd generation PAMAM dendrimers (0.3 mg/mL, 1.5 mg/mL and 3.0 mg/mL) for 24 h and subsequent staining with Annexin V and propidium iodide (PI). Dots with Annexin V−/PI− (left lower square), Annexin V+/PI− (right bottom square), Annexin V+/PI+ (right upper square), and Annexin V−/PI+ (left upper square) feature represent intact, early apoptotic, late apoptotic, and necrotic cells, respectively. Mean percentage values from three independent experiments (n=3) done in duplicate are presented. *p<0.05 versus the control group.
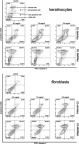
Figure 8 Flow cytometric analysis of population keratinocyte and fibroblast cells treated for 24 h with 2nd and 3rd generation PAMAM dendrimers (0.3 mg/mL, 1.5 mg/mL and 3.0 mg/mL) for active caspase-3. Mean percentage values from three independent experiments (n=3) done in duplicate are presented. *p<0.05 versus the control group.
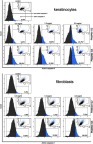
Figure 9 Flow cytometric analysis of population keratinocyte and fibroblast cells treated for 24 h with 2nd and 3rd generation PAMAM dendrimers (0.3 mg/mL, 1.5 mg/mL and 3.0 mg/mL) for active caspase-8. Mean percentage values from three independent experiments (n=3) done in duplicate are presented. *p<0.05 versus the control group.
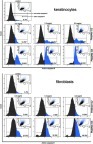
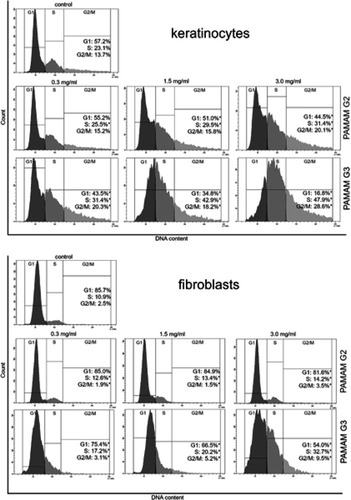
Figure 10 Flow cytometric analysis of cell cycle of keratinocyte and fibroblast cells after 24 h of incubation with different concentrations (0.3 mg/mL, 1.5 mg/mL and 3.0 mg/mL) of 2nd and 3rd generation PAMAM dendrimers using propidium iodide staining. Mean percentage values from three independent experiments (n=3) done in duplicate are presented. *p<0.05 versus the control group.