Figures & data
Figure 1 Morphology of high (A) and low (B) vildagliptin-eluting nanofibers, examined by scanning electron microscopy (SEM) with a magnification of 2000×. The measured mean diameters of nanofiber were 1152.9±448.8 nm (C) in group A and 365.0±135.7 nm (D) in group B (p<0.001). (Scale bar: 20 μm) (E) Daily and (F) accumulated delivery of vildagliptin from nanofibrous tubes in vitro. In vitro: transwell filter migration assay. Remarkable effect of dose on migration of ECs was noted. Ratios of migration of ECs treated with high- (G) and low- (H) dose vildagliptin eluents (day 14) to that on the control group (I) were 224±33% and 161±34%, respectively.
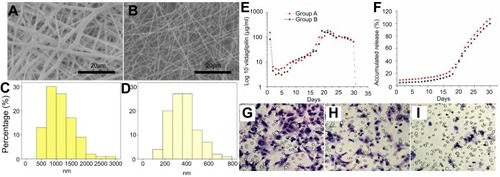
Figure 2 Stent and angiograms in rabbit descending aorta. (A) Photograph of vildagliptin-eluting stent. The nanofibrous tube was made on a bare-metal stent. (Scale bar: 5 mm) (B) Angiograms of rabbit vasculature in area of stent implantation (red arrow head) (scale bar: 10 mm) following injection of contrast dye from femoral artery (red asterisk). (C) Locations of rabbit vasculature.
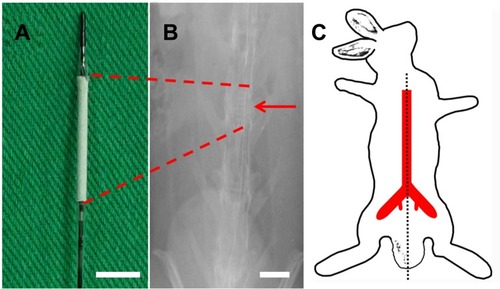
Figure 3 Evaluation of the coverage and morphology of endothelium and in vivo endothelial function after 3 weeks of stenting treatment was evaluated from variation in abdominal aorta diameter using different acetylcholine dose infusions. The coverage of endothelium on struts in three groups at 8 weeks at different magnifications (35×: a, b, and c with scale bar: 500 μm; 200×: d, e, and f with scale bar: 250 μm). (A) Group A had full coverage. (B) Almost full coverage was noted on stent struts in group B. (C) The region in which stents were deployed was poorly covered in group C. (D and E) Endothelial cells in groups A and B were aligned parallel to the flow direction with regularly shaped endothelial cells among each other by close contact. (F) Endothelial alignment of stenting vessels in group B was more weakly in flow direction. Extended and uneven intercellular spaces, irregular size of endothelial cells, and poorly aligned surface were shown in group C. (G) Significantly greater responses in vildagliptin-eluting stent than that in non-drug-eluting stent were observed according to endothelial-dependent vasodilatory reaction to Ach. (*p<0.05 group A versus group C; # p<0.05 group B versus group C).
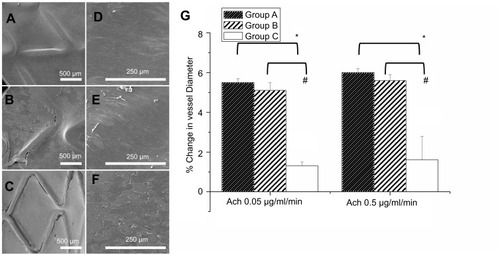
Figure 4 H&E staining of vessel sections after eight weeks (×200). The degradable nanofibrous membranes coated outside of implanted stents were noticed between dotted line and double arrow. Inflammation response was small around stent struts in all groups (asterisk). Groups A (A) and B (B) exhibited almost no neointimal formation, but group C (C) revealed significant neointimal formation with nearly 200 μm thickness (scale bar: 100 μm). Immunofluorescence of type I collagen. Type I collagen (orange) of vildagliptin-eluting (a: high dose and b: low dose) and non-vildagliptin-eluting nanofibrous membrane stent (C). DAPI stained nuclei (blue) and autofluorescence on tunica media (green) are also displayed, respectively. Lower labeling level with collagen type I was detected near drug-eluting stented vessels. Double arrow indicates elastic lamina. Marked neointima hyperplasia owing to the growth of smooth muscle cells in media leads to expression of intima and media regions in group C (c2, double arrow) (scale bar: 100 μm).
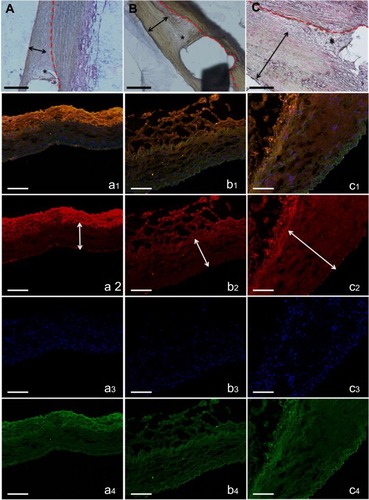
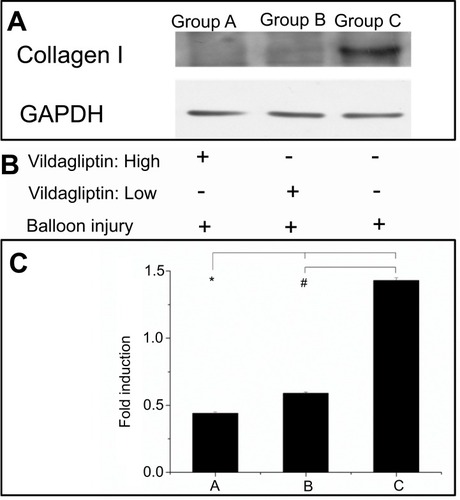
Figure 5 Western blot of collagen I content (A). After balloon injury, various groups with stents loaded and not loaded with vildagliptin-eluting nanofibers, or without stents (B). Relative expression of each protein was quantified by densitometry as a ratio of density to that of corresponding GAPDH (C). Each value is presented as mean ± SE. (*# p<0.001 group A or B versus group C in post hoc analysis.