Figures & data
Scheme 1 Schematic diagram showing the conjugation of CuInS/ZnS and meso-tetra-(4-sulfonatophenyl) porphyrin (TPPS4).
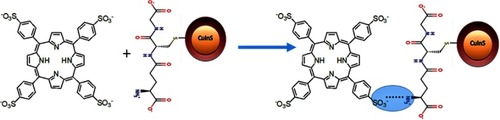
Figure 1 (A) FTIR spectra of GSH and GSH-capped CuInS/ZnS QDs, (B) PL spectra of CuInS QDs core and CuInS/ZnS QDs core\shell, (C) PL spectra and (D) absorption spectra of CuInS\ZnS QDs core-shell at different Zn:Cu + In ratio.
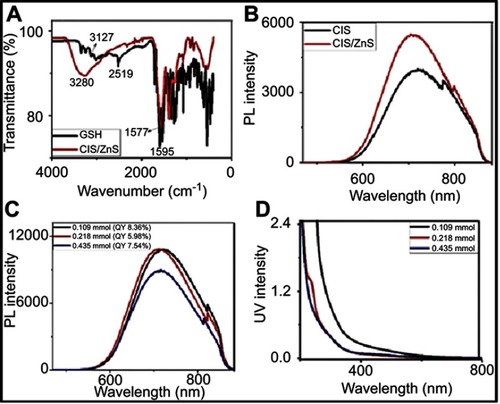
Figure 2 (A, B) TEM images of CuInS/ZnS QDs, SEM of CuInS QDs (C) and CuInS/ZnS QDs (D) and the EDS of CuInS QDs (E) and CuInS/ZnS QDs (F).
Abbreviations: TEM, transmission electron microscopy; QDs quantum dots ; SEM, scanning electron microscopy; EDS, electron dispersive spectroscopy.
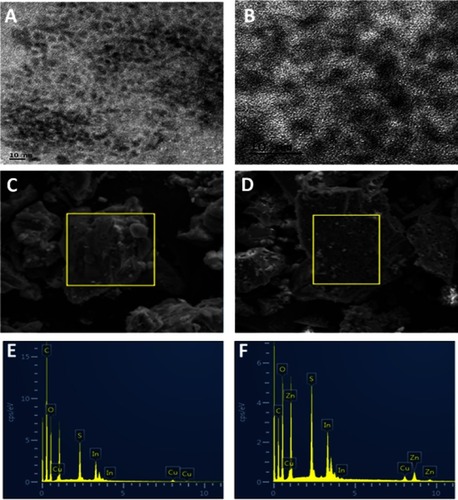
Figure 3 FTIR spectra of (A) TPPH2, (B) TPPS4; absorption spectra of (C) TPPH2 in DMSO, (D) water-soluble TPPS4; 1H NMR spectra of (E) TPPH2 and (F) TPPS4.
Abbreviations: FTIR, Fourier-transform infrared spectroscopy; NMR, nuclear magnetic resonance.
Figure 4 Effect of pH on (A) UV absorption and (B) Photoluminescence (PL) emissions of TPPS4.
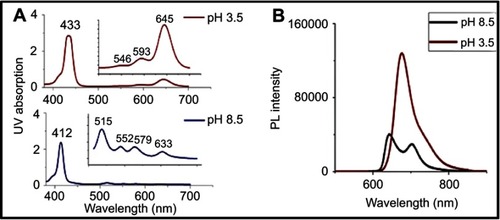
Table 1 Effect of pH on the stokes shift of TPPS4
Figure 5 (A) Photoluminescence (PL) spectra of TPPS4 at different excitation wavelengths, (B) PL spectra and (C) absorption spectra at different CuInS/ZnS:TPPS4 ratios and (D) radar chart of CuInS/ZnS–TPPS4 conjugate at different synthetic temperatures (insert: area chart of the conjugate).
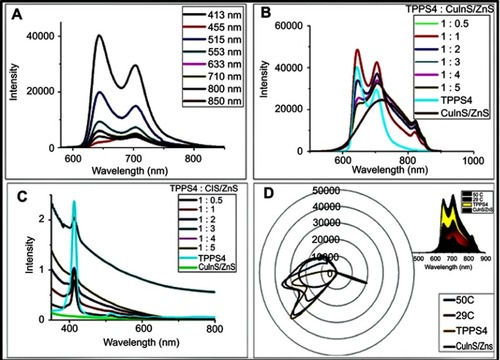
Figure 6 Fourier-transform infrared spectroscopy (FTIR) of TPPS4, CuInS/ZnS and TPPS4–CuInS/ZnS conjugate.
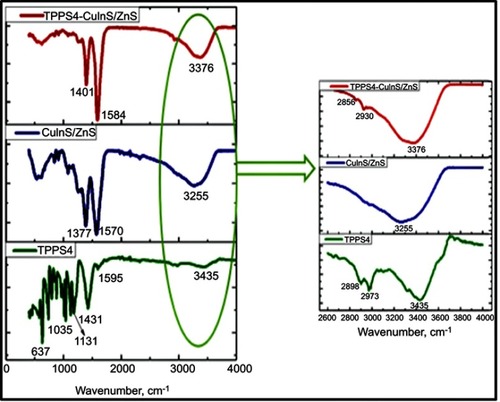
Figure 7 Singlet oxygen detection of (A) TPPS4, (B) CuInS/ZnS–TPPS4 conjugate and (C) 1,3-diphenylbenzofuran (DPBF) alone (inserts: changes in emission spectra of DPBF in presence of (A) TPPS4, (B) conjugate and (C) DPBF alone).
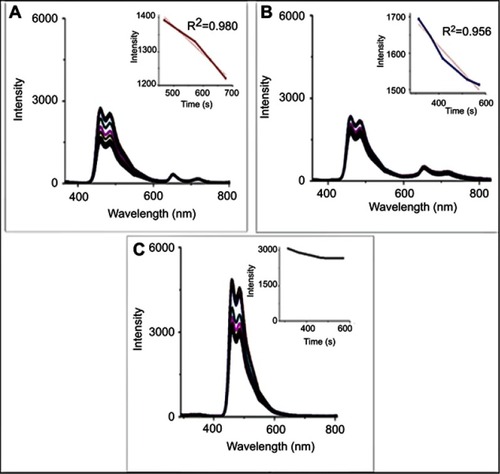
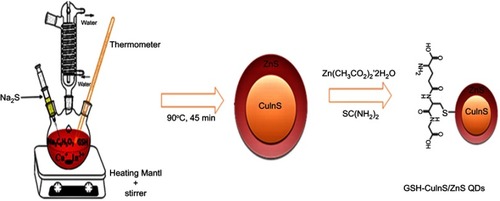
Figure S1 Hydrothermal synthesis of GSH-capped CuInS/ZnS.
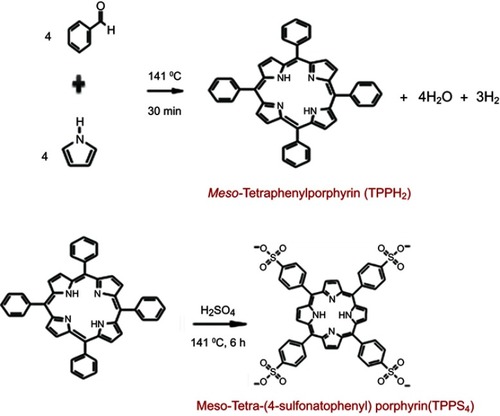
Scheme S2 Schematic diagram for the synthesis of TPPS4.