Figures & data
Figure 1 Schematic representation for the synthesis of (A) hyaluronic acid-octadecanoic acid (HA-C18) and (B) alendronate-hyaluronic acid-octadecanoic acid (ALN-HA-C18).
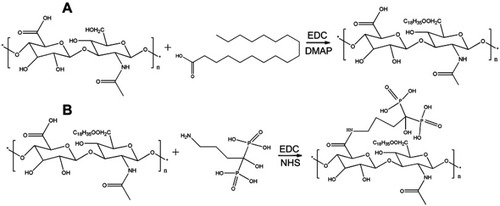
Table 1 The orthogonal design factors and levels
Figure 2 1H NMR spectrum of (A) hyaluronic acid (HA) and (B) alendronate-hyaluronic acid-octadecanoic acid (ALN-HA-C18).
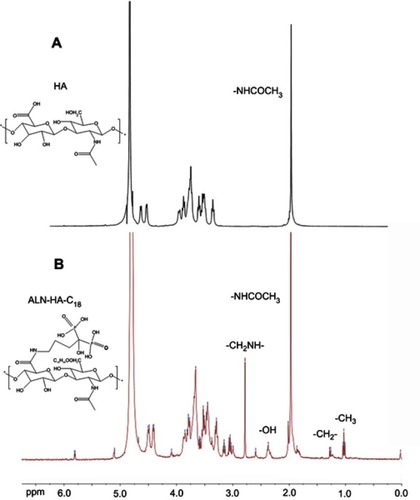
Figure 3 Plots of I1/I3 against the logarithim of the ALN-HA-C18 concentration.
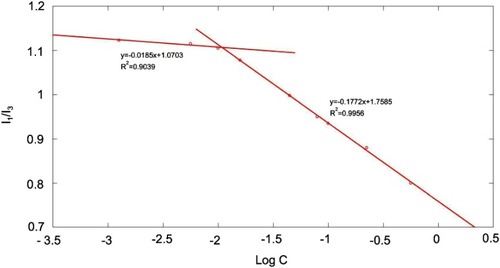
Table 2 The orthogonal design L9 (34) and resulting values
Figure 4 The size distribution (A) and transmission electron microscopy (TEM) image (B) of CUR loaded ALN-HA-C18 micelles. (C) In vitro release characteristics of free CUR and CUR loaded ALN-HA-C18 micelles in 1% Tween 80 PBS medium. (D) Binding ratio of CUR, CUR loaded HA-C18 micelles, and CUR loaded ALN-HA-C18 micelles with hydroxyapatite. Data are presented as the mean ± SD (n=3). ***Significant difference between the two groups (***P<0.001).
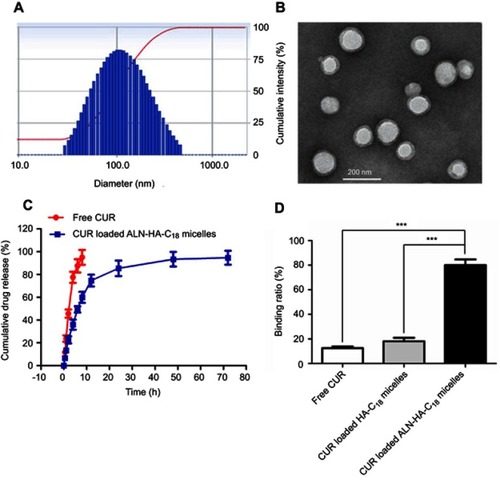
Figure 5 In vitro cytotoxicity of blank ALN-HA-C18 micelles, free CUR, and CUR loaded ALN-HA-C18 micelles against HOB cells (A) and MG-63 osteosarcoma cells (B). Fluorescence microscope images (C) and flow cytometry analysis (D) of MG-63 cells incubated with free C6, C6 loaded ALN-HA-C18 micelles with HA and C6 loaded ALN-HA-C18 micelles. Data are presented as the mean ± SD (n=6). *, ** and *** represent P<0.05, P<0.01 and P<0.001, respectively. The bar is 50 μm.
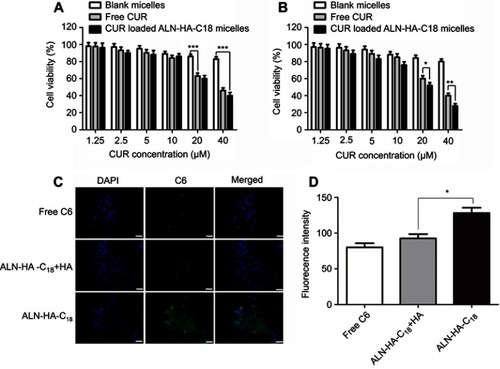
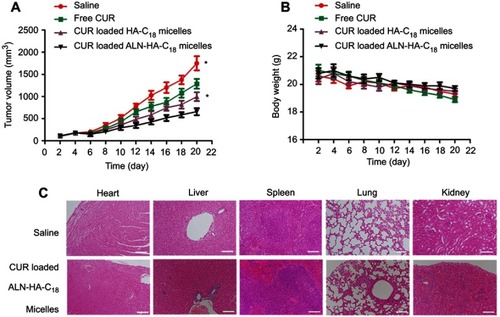
Figure 6 The in vivo antitumor activity of CUR loaded ALN-HA-C18 micelles on osteosarcoma bearing nude mice. (A) Tumor volume changes; and (B) body weight changes. (C) The hematoxylin and eosin (H&E) staining of the heart, liver, spleen, lung and kidney in saline and CUR loaded ALN-HA-C18 micelles group after treatment. Data are presented as the mean ± SD (n=6). *Represents P<0.05. Bars =100 μm.