Figures & data
Scheme 1 Schematic illustration of microstructure of F3-PLGA@MB/Gd nanoparticle and combined application of HIFU and SDT for precise theranostics of breast cancer.
Abbreviations: PLGA, ploy(lactide-co-glycolic acid); HIFU, high intensity focus ultrasound; SDT, sonodynamic therapy.
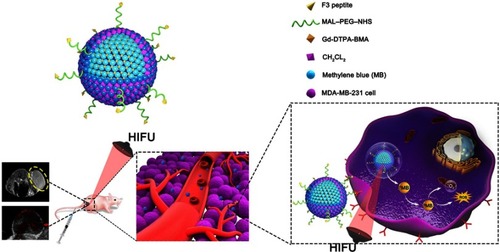
Figure 1 (A) HPLC analysis of MAL-PEG-PLGA-F3 after modification. (B) HPLC analysis of MAL-PEG-PLGA-F3 after purification. (C) Optical microscopy image of F3-PLGA@MB/Gd NPs, scale bar: 20 μm. (D) SEM image of F3-PLGA@MB/Gd NPs, scale bar: 1 μm. (E) TEM image of F3-PLGA@MB/Gd NPs, scale bar:200 nm. (F) CLSM image of Dil-F3-PLGA@MB/Gd NPs, scale bar: 10 μm. (G) Size distribution of F3-PLGA@MB/Gd NPs. (H) Zeta potential of F3-PLGA@MB/Gd NPs (n=3).
Abbreviations: HPLC, high performance liquid chromatography; MAL, maleimide; PEG, polyethylene glycol; PLGA, poly(lactide-co-glycolic acid); NPs, nanoparticles; SEM, scanning electron microscope; TEM, transmission electron microscope; CLSM, confocal laser scanning microscope.
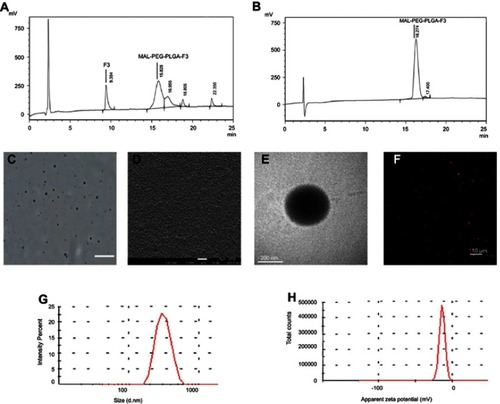
Figure 2 (A) CLSM images of MDA-MB-231 cells incubated with Dil-labeled F3-targeted NPs and non-targeted NPs. From top to bottom are DiI-labeled nanoparticles, the DAPI-labeled nuclei, DIO -labeled cytolemma and their overlay, scale bar: 50 μm. (B) CLSM images of HUVEC cells incubated with Dil-labeled F3-targeted NPs. (C) Multi-level scan at 10 μm intervals for the penetration of Dil-F3-PLGA@MB/Gd NPs and Dil-PLGA@MB/Gd NPs(left) and confocal images of MDA-MB-231 tumor spheroids (right). Scale bar: 250 μm. (D) 3D-reconstruction of the MDA-MB-231 tumor spheroids in the Dil-F3-PLGA@MB/Gd group and DiI-PLGA@MB/Gd group. (E) Quantitative analysis of fluorescence intensity value in F3-targeted group and non-targeted group (*P<0.05, **P<0.01).
Abbreviations: CLSM, confocal laser scanning microscope; NPs, nanoparticles; HUVEC, human umbilical vein endothelial cells; PLGA, poly(lactide-co-glycolic acid); MB, Methylene blue; Gd, gadodiamide;3D, three-dimensional.
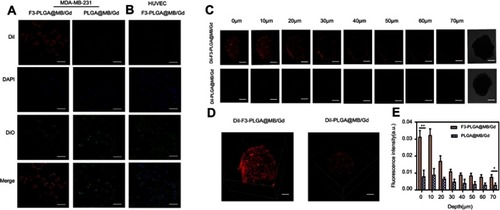
Figure 3 (A) CLSM images of intracellular ROS under US wave irradiation (0.5W, 30s) in various groups. Scale bar: 50 μm. (B) Quantitative analysis of CLSM images (*P<0.05). (C) Measurement of ROS in MDA-MB-231 cells of various groups with DCFH-DA staining by using flow cytometry under the US irradiation (0.5 W, 30s). (D) Apoptosis detection by flow cytometry in various groups. (E) Quantitative analysis of apoptosis as determined by FCM (*P<0.05). (F) Cell viabilities as measured by the CCK-8 assay (*P<0.05).
Abbreviations: CLSM, confocal laser scanning microscope; ROS, reactive oxygen species; US, ultrasound; FCM, flow cytometry.
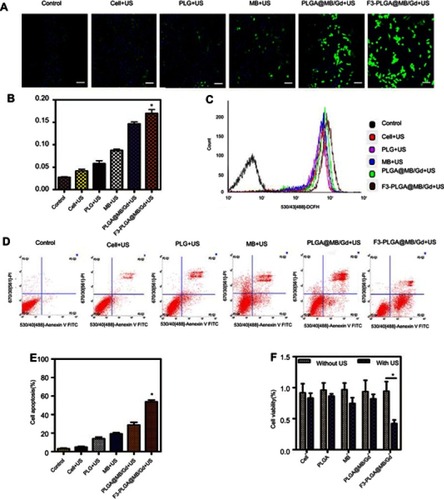
Figure 4 (A) In vivo imaging system (IVIS) fluorescence images of the nude mice bearing MDA-MB-231 tumors 1h, 2h, 4h, 6h, 12h, 24h after intravenous administration of DiR-labeled F3-PLGA@MB/Gd NPs and DiR-labeled PLGA@MB/Gd NPs. (B) Ex vivo fluorescence imaging of tumor and main organs 24h after intravenous administration of DiR-labeled F3-PLGA@MB/Gd NPs and DiR-labeled PLGA@MB/Gd NPs. (C) In vivo tumor-to-background ratios after different time points intravenous injection. (D) Quantification of fluorescence intensity of tumor and dissected organs. (E) DiI-labeled F3-PLGA@MB/Gd NPs or PLGA@MB/Gd NPs distribution in tumor and liver tissues. Scale bar: 50 μm. *P<0.05.
Abbreviations: NPs, nanoparticles; PLGA, poly(lactide-co-glycolic acid); MB, Methylene blue; Gd, gadodiamide.
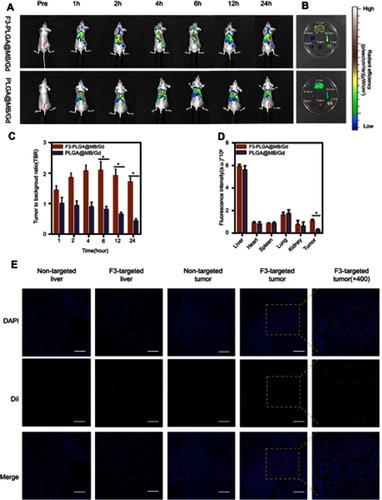
Figure 5 (A)In vitro T1W1 MR images and MRI signal intensities of F3-PLGA@MB/Gd NPs solution at different concentrations (5.0, 10, 15, 20, 25 mg/mL). (B) In vitro PA images and PA values of F3-PLGA@MB/Gd NPs solution at different concentrations (5.0, 10, 15, 20, 25 mg/mL). (C) In vivo T1W1 MR images and the corresponding MRI signal intensities (D) post injection of F3-PLGA@MB/Gd NPs, PLGA@MB/Gd NPs, and saline at different time points (n=3 per group, *P<0.05). (E) In vivo PA images and corresponding PA values (F) Post injection of F3-PLGA@MB/Gd NPs, PLGA@MB/Gd NPs, and saline at different time points (n=3 per group, *P<0.05).
Abbreviations: MRI, magnetic resonance imaging; PLGA, poly(lactide-co-glycolic acid); MB, methylene blue; Gd, gadodiamide; NPs, nanoparticles; PA, photoacoustic.
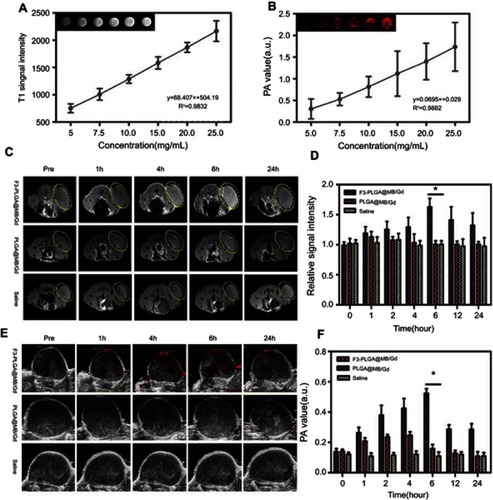
Figure 6 (A) B-mode ultrasound images of degassed bovine livers before and after HIFU exposure at 120 w, 3 s. (B) Digital photos of degassed bovine livers under HIFU irradiation after intra-tissue injection of various agents: PBS, PLGA, MB, PLGA@MB/Gd. (C) B-mode ultrasound images of MDA-MB-231 tumor tissues before and after HIFU exposure at 120 w, 3 s. (D) The mean grey difference calculation based on the ultrasound imaging of bovine liver tissue after various treatment. (*P<0.05). (E) The calculated coagulation volume of bovine liver tissue after HIFU treatments (*P<0.05). (F) The mean grey difference calculation based on the ultrasound imaging of MB-231 tumor tissue after HIFU treatment (*P<0.05).
Abbreviations: B-mode, brightness-mode; HIFU, high intensity focus ultrasound; PBS, phosphate buffer saline; PLGA, poly(lactide-co-glycolic acid); MB, methylene blue; Gd, gadodiamide.
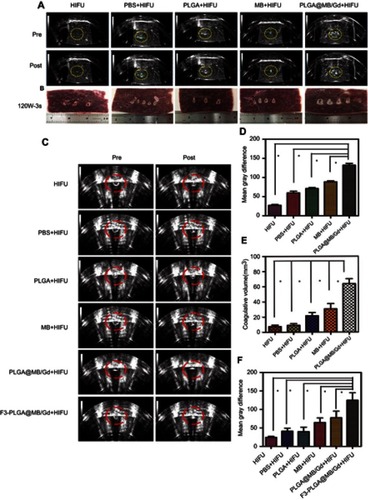
Figure 7 (A) H&E staining (magnification, 100×), (B) PCNA staining (magnification, 400×) and (C) TUNEL staining (magnification, 400×) of MDA-MB-231 tumor tissues in various groups after HIFU ablation. (D) proliferative index and (E) apoptosis index in various groups. (*P<0.05).
Abbreviations: H&E, hematoxylin-eosin; PCNA, proliferating cell nuclear antigen; TUNEL, terminal deoxynucleotidyl transferase-mediated dUTP nick end labeling.
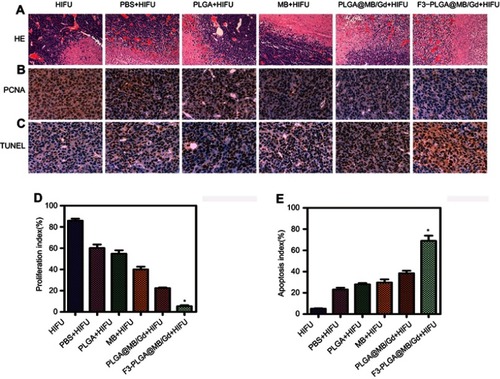
Figure S1 Digital photo of MAL-PEG-PLGA-F3 and 1H NMR spectra of MAL-PEG-PLGA-F3 (7.0–8.0 F3 peptide, 3.5 PEG, 3.3 MAL, 4.5–5.5 and 1.0–1.5 PLGA).
Abbreviations: MAL, maleimide; PEG, polyethylene glycol; PLGA, poly(lactide-co-glycolic acid); NMR, nuclear magnetic resonance.
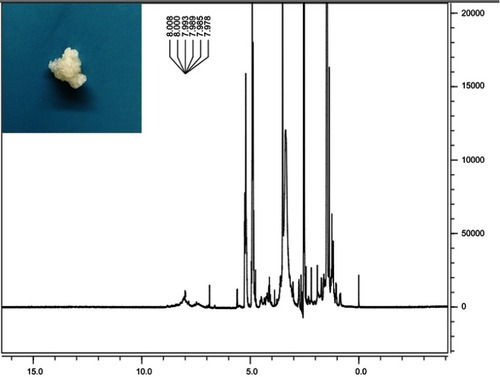
Figure S2 UV-visible spectrum of free MB and F3-PLGA@MB/Gd nanoparticles.
Abbreviations: UV, ultraviolet spectrum; MB, methylene blue; PLGA, poly(lactide-co-glycolic acid); Gd, gadodiamide.
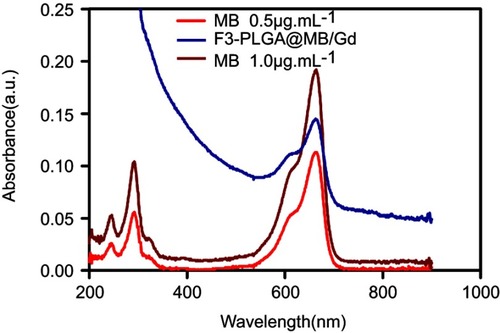
Figure S3 Cellular uptake of nanoparticles within one hour. Scale bar: 50 μm
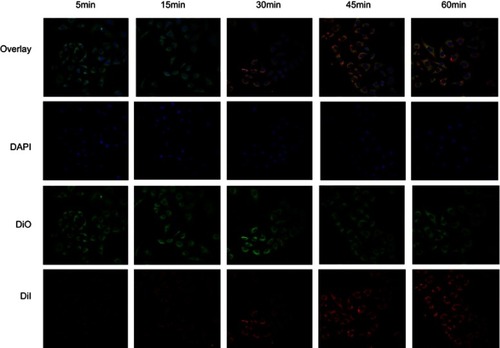
Figure S4 1O2 generation by F3-PLGA@MB/Gd NPs after US irradiation for different time periods
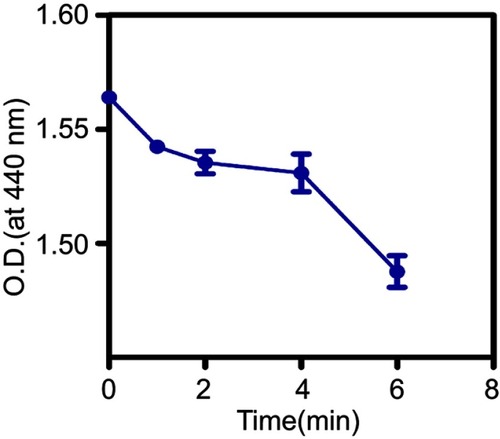
Figure S5 Cytotoxicity against MB-231 cells with F3-PLGA@MB/Gd. Abbreviations: PLGA, poly(lactide-co-glycolic acid); MB, methynele blue; Gd, gadodiamide
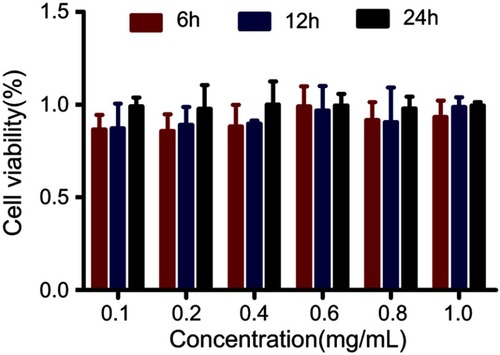
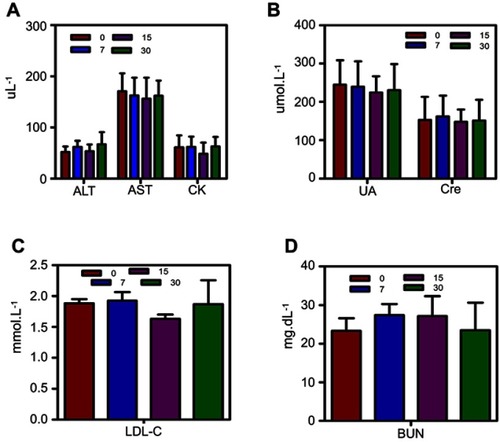
Figure S6 Liver function (ALT, AST), renal function (BUN, UA, Cre), and heart function (CK, LDL-C) of mice before injection and at 7-day, 14-day, 30-day after intravenous injection of F3-PLGA@MB/Gd