Figures & data
Table 1 Coefficients of organs to body weight (BW) of mice at 24 hrs and 7 days after intravenously injected of Mn-doped ZnS QDs
Table 2 Relative hematology results after injection of Mn-doped ZnS QDs
Figure 1 Blood biochemical parameters after intravenous injection of Mn-doped ZnS QDs. (A) Alanine aminotransferase, (B) aspartate aminotransferase, (C) albumin, (D) creatinine, (E) alkaline phosphatase, (F) lactate dehydrogenase, (G) urea, and (H) total bilirubin levels. All data are presented as mean S.E.M. (n=6). p<0.05, p<0.01,and p<0.001 vs control according to ANOVA.
Abbreviations: QDs, quantum dots; ANOVA, analysis of variance.
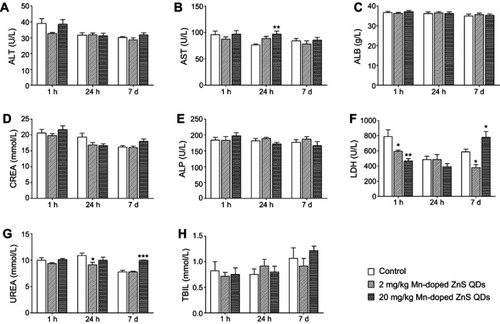
Figure 2 Histological analyses of organs after intravenous injection of Mn-doped ZnS QDs at 7 days. (A) control, (B) 20 mg/kg Mn-doped ZnS QDs.
Abbreviation: QDs, quantum dots.
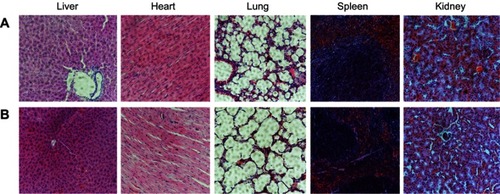
Figure 3 Discriminating plots of control and Mn-doped ZnS QDs groups obtained from GC–MS analysis: (A) and (D) score plots of the PCA model, (B) and (E) score plots of the PLS-DA model, (C) and (F) plot of the permutation test (200 times) of the PLS-DA model.
Abbreviations: QDS, quantum dots; GC–MS, gas chromatography–mass spectrometry; PCA, principal component analysis; PLS-DA, partial least squares discriminant analysis.
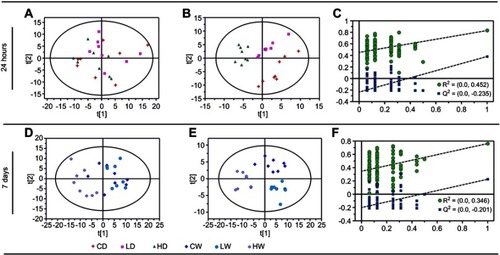
Figure 4 Metabolic profiling between different dosage of Mn-doped ZnS QDs and controls at 24 hrs and 7 d. (A–D) score plots of the PCA model, (E–H) score plots of the PLS-DA model, (I–L) plot of the permutation test (200 times) of the PLS-DA model, (M–P) scores plot of the OPLS-DA model.
Abbreviations: QDS, quantum dots; PCA, principal component analysis; PLS-DA, partial least squares discriminant analysis; OPLS-DA, orthogonal PLS-DA.
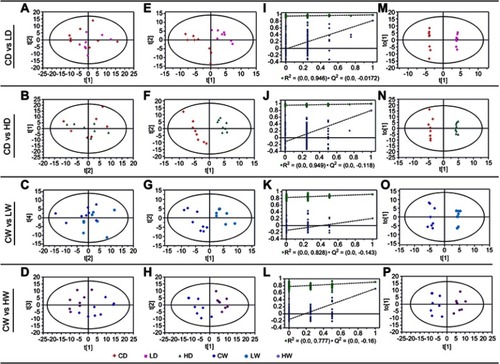
Table 3 Significantly changed metabolites found in GC/MS-based metabolomic profiling
Figure 5 Venn diagrams showing the overlap of changed metabolites between different dosage of Mn-doped ZnS QDs and controls at 24 hrs and 7 days.
Abbreviations: QDS, quantum dots; LD: 2 mg/kg Mn-doped ZnS QD at 24 hrs; HD, 20 mg/kg Mn-doped ZnS QDs at 24 hrs; LW: 2 mg/kg Mn-doped ZnS QD at 7 days; HW, 20 mg/kg Mn-doped ZnS QDs at 7 days.
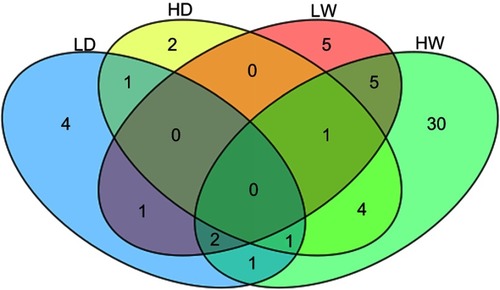
Figure 6 Map illustrating the most predominant disturbed metabolic pathway of significantly changed metabolites between different dosage of Mn-doped ZnS QDs and controls at 24 hrs and 7 days. LD: empty triangle, HD: filled triangle, LW: empty arrow and HW: filled arrow. The up shapes represent up-regulation and down shapes represent down-regulation of the metabolites in Mn-doped ZnS QDs-treated mice.
Abbreviations: QDS, quantum dots; CoA, coenzyme A; TCA, tricarboxylic acid cycle; LD: 2 mg/kg Mn-doped ZnS QD at 24 hrs; HD, 20 mg/kg Mn-doped ZnS QDs at 24 hrs; LW: 2 mg/kg Mn-doped ZnS QD at 7 days; HW, 20 mg/kg Mn-doped ZnS QDs at 7 days.
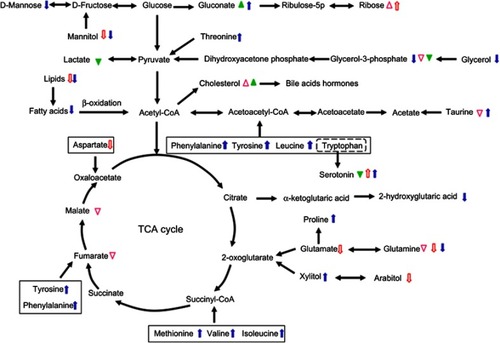
Figure S1 Representative total ion current (TIC) chromatographs from control, 2 and 20 mg/kg Mn-doped ZnS QDs-treated groups.
Abbreviation: QDs, quantum dots.
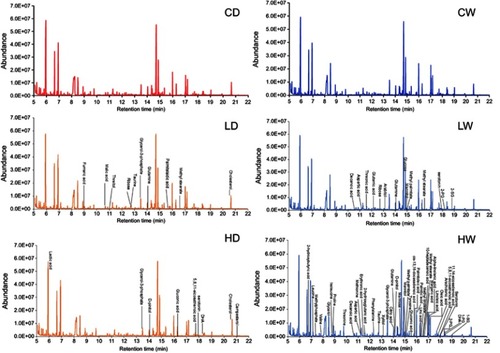
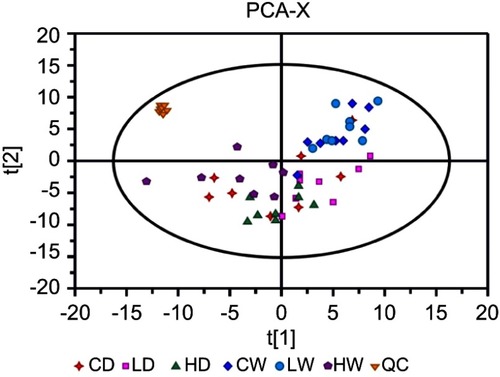
Figure S2 Score plots of the PCA model of all serum samples and QC samples. The parameters of PCA were 8 PC, R2X=0.709. QC samples were all together in one place, suggesting favorable reproducibility of the method.
Abbreviations: PCA, principal component analysis; QC, quality control.