Figures & data
Figure 1 The steps of QNPs synthesis. (A) The schematic picture of DNPs and QNPs synthesis; DNPs were prepared using chemical co-precipitation method and in the presence of dextran; and Qu was conjugated to DNPs with helping EDC and NHS as linkers. (B) The chemical pathway of DNPs and QNPs synthesis.
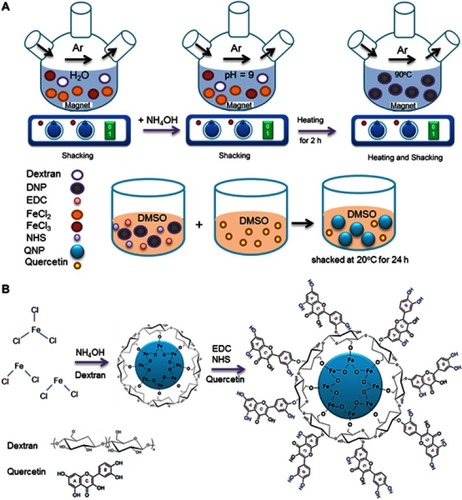
Figure 2 Physicochemical characterization of DNPs and QNPs. (A) The results of FTIR confirmed that the polymerization of dextran on and conjugation of Qu to the surface of IONPs was correctly performed. (B) The XRD image showed that DNPs and QNPs were in pure crystal phase and verified Fe3O4 identity. (C) The magnetic properties of QNPs (red arrow shows QNPs aggregate). The DLS results (D) and the SEM pictures (E) of QNPs confirmed the size of the NPs was in the nanometer range. (F) The EDX spectroscopy verified the identity of the IONPs.
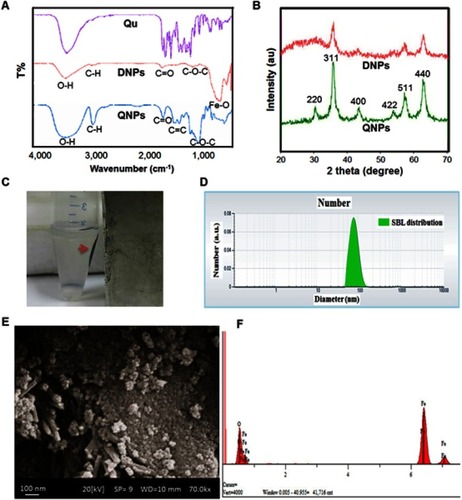
Figure 3 Drug release from QNPs. (A) Schematic picture of dialysis; (B) the standard curve of Qu absorption in PBS; (C) drug release graph shows that there isn’t a significant difference between two pH during first 24 h, while the difference was increased at the next days (n=3, mean ± SEM).
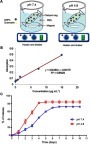
Figure 4 Catalase-like activity of DNPs and QNPs. (A) The interaction of DNPs and QNPs with H2O2; the observation of O2 bulbs confirms the catalase-like activity. (B) The graph of catalase-like activities of DNPs and QNPs; both NPs have dose-dependent catalase-like activities. (C) The total antioxidant capacity (TAC) graph of Qu and QNPs; Qu had a dose-dependent capacity and the conjugation of Qu to DNPs led to a noticeable reduction in its antioxidant capacity. n=3, mean ± SEM, the difference of a-b is p<0.0001 and a’-b’ is p<0.001. ****p<0.0001.
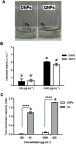
Figure 5 DPPH scavenging effects of Qu, DNPs, and QNPs. (A) The graph indicates that Qu had most free radical scavenging activity compared to QNPs and DNPs; and its activity increased along with elevating concentration, while its activity didn’t depend on time. (B) The graph of DNPs activity showed lowest free radical scavenging activities. Except for dose 10 µg.mL−1 which had no effect, DNPs indicated improvement in their activities along with increasing concentration and time. (C) The graph indicated QNPs had dose- and time-dependent free radical scavenging effects (n=3, mean ± SEM). *p<0.05, **p<0.01, ***p<0. 001, and #p<0. 0001.
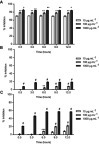
Figure 6 The toxicity of Qu, DNPs, and QNPs on PC12 cells. (A) The MTT assay results of Qu; Qu has dose- and time-dependent toxicity on the PC12 cells (a-b, b-c, c-d, d-e, a’-b’, b’-c’, c’-d’, d’-e’, a’’-b’’, b’’-c’’, c’’-d’’, d’’-e’’, and e’’-f’’ have significant differences with *, ****, ***, *, **, ***, *, **, ***, ****, ****, and *, respectively). (B) The MTT assay data of DNPs; DNPs have low toxicity on the cells (a-b, a’-b’, a’’-b’’, and b’’-c’’ have significant differences with *). (C) The MTT assay results of QNPs; QNPs had dose- and time-dependent cytotoxicity (a-b, a’-b’, a’’-b’’, b’’-c’’, c’’-d’’, and d’’-e’’ have significant differences with * and b’-c’ have significant differences with **). *p<0.05, **p<0.01, ***p<0.001, and ****p<0.0001, respectively. n=6, mean ± SEM.
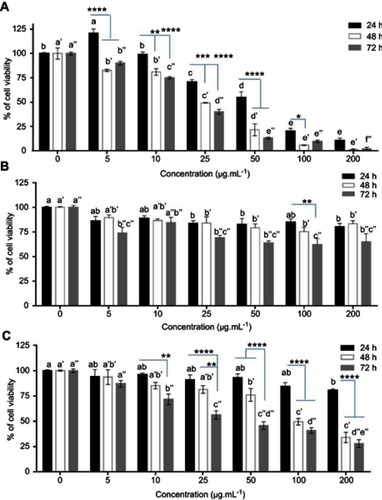
Figure 7 QNPs entrance into the PC12 cells. (A) Schematic picture of ICP assay and Prussian blue staining. (B) The drug release graph; the intracellular concentration of iron in PC12 cells was elevated along with increasing the dose of QNPs (n=3, mean ± SEM). *p<0.05 and **p<0.01, respectively). (C-F) Prussian blue staining pictures; PC12 cells were incubated with 0 (C), 25 (D), 50 (E) and 100 µg.mL−1 (F) concentrations of QNPs. The blue colored points observed on the surrounds and enter the cells confirm the entrance of QNPs into the cells. Arrows indicate QNPs.
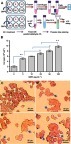
Figure 8 The antitoxic effects of Qu and QNPs against H2O2 on the PC12 cell viability. (A) The effect of 24 h pre-incubation with QNPs or Qu before H2O2 treatment on PC12 cells viability; the low doses of QNPs or Qu significantly improved the cell viability. (B) The effect of 48 h pre-incubation with QNPs or Qu; the low doses of QNPs or Qu significantly increased the cell viability. (C) The effect of 72 h pre-incubation with QNPs or Qu; there is no significant protective effect against H2O2 (n=9, mean ± SEM). *p<0.05, **p<0.01, ***p<0.001, and ****p<0.0001.
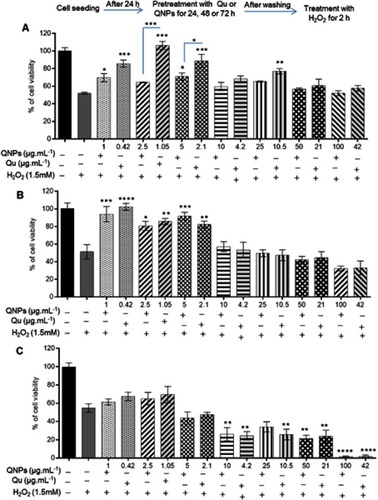
Figure 9 The protective effects of Qu and QNPs against H2O2 in PC12 cells. (A) The graph of staining with DCFDA kit; incubation with the low doses of Qu or QNPs reduced ROS level induced by H2O2. (B–D) The relative expression levels graph of iNOS, TNF-α, and Bax genes; pretreatment with the low concentrations of Qu and QNPs decreased the mRNA contents of iNOS, TNF-α, and Bax increased by H2O2 (n=3, mean ± SEM). **p<0.01, ***p<0.001, and ****p<0.0001.
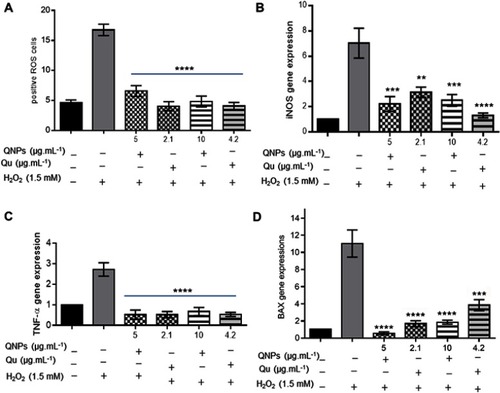
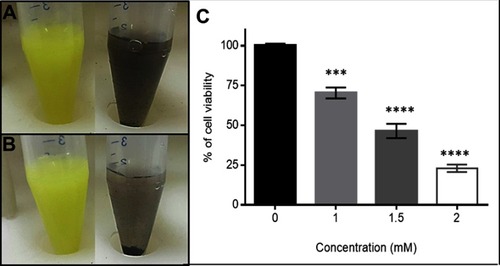
Figure S1 The study of the Qu and QNPs solubility and H2O2 cytotoxicity. (A) The comparison of Qu and QNPs solubility as soon as dissolved in water; and (B) three minutes after dissolution; shows that conjugation of Qu to DNPs couldn’t increase its solubility. (C) The MTT assay results of incubating PC12 cells with different concentrations of H2O2 for 2 h indicates the dose-dependently cytotoxicity of H2O2. ***p<0.001; ****p<0.0001; n=3; mean ± SEM