Figures & data
Figure 1 Schematic illustration of the assembly method, synthesizing process and theranostic procedures of the acoustic-responsive DPP-R, including double emulsion and carbodiimide method for synthesizing, active and passive targeting effect induced by receptor/ligand, and EPR effect and LIFU-mediated phase-transition and accurate drug release for theranostics.
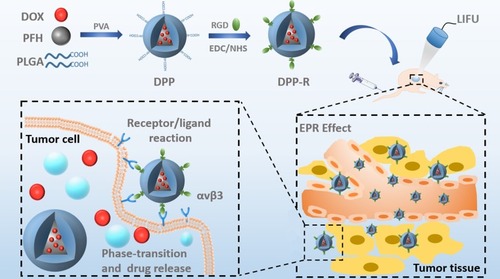
Figure 2 (A) Optical microscope image (×600). (B) TEM image. (C) Average size of DPP-R. (D) Zeta potential of PP, DPP, and DPP-R. (E) Size of PP, DPP, and DPP-R. (F) Size of DPP-R in PBS, FBS, and high glucose DMEM in 7 days. (G) The UV-Vis-NIR absorption curve of PP, DOX, and DPP. (H) The UV-Vis-NIR absorption curve of DOX in different concentrations. (I) Standard curve of DOX related to concentration and absorbance intensity. (The data were shown as mean±SD, n=3).
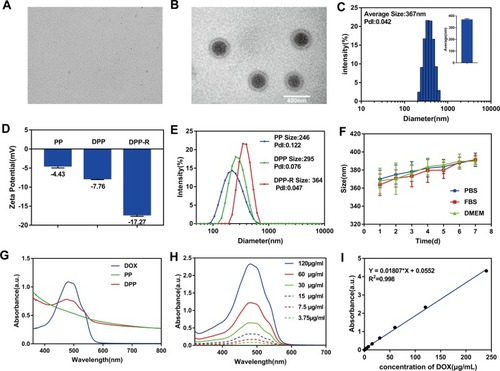
Figure 3 (A) Drug cumulative release of DPP-R in PBS (pH=5.2/7.4) at 37°C with or without LIFU irradiation at 6 h. (B) CLSM images of facilitated DOX release triggered by LIFU. The red fluorescence represented released DOX; the blue fluorescence marked cell nucleus (×400). (The data were shown as mean±SD, n=3).
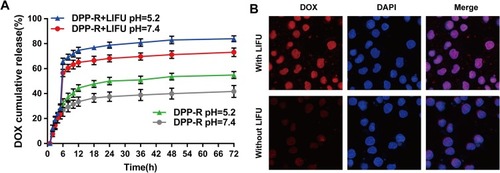
Figure 4 Bio-compatibility and bio-safety of original materials. (A) Cell viability of MGC-803 after incubated with NPs for 24 h and tested by CCK-8 assay. (B) H&E staining of major organs of control group and PP-R group at 1 day, 7 days, and 14 days after being intravenously injected with PP-R (×400). (C) Major indicators of routine blood and blood biochemistry examination of control, PP, and PP-R groups at 1 day, 7 das, and 14 days. (The data were shown as mean±SD, n=3).
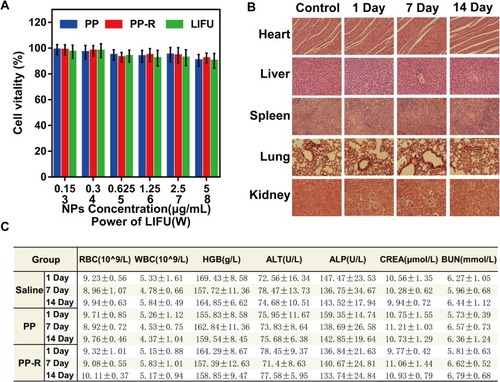
Figure 5 Targeting ability of DPP-R in vitro. (A) CLSM images of DPP-R. The red fluorescence represented encapsulated DOX; the green fluorescence represented RGD-FITC; the red and green fluorescence overlapped almost indicating that RGD successfully bound with DPP (×1000). (B) Binding efficiency between RGD and DPP measured by FCM. (C) CLSM images of MGC-803 incubated with DPP-R and DPP respectively for 3 h. The red fluorescence represented encapsulated DOX; the green fluorescence of DiO marked cell membranes and the blue fluorescence of DAPI marked cell nucleus (×400). (D) Binding efficiency between NPs and cells measured by FCM. (The data were shown as mean±SD, n=3, *p<0.05).
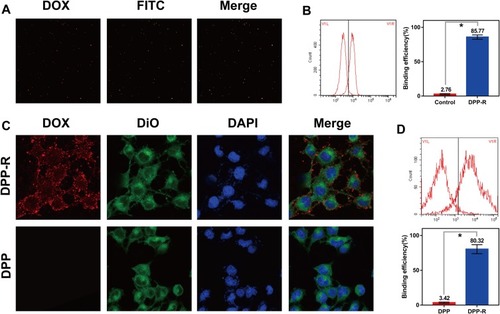
Figure 6 Targeting ability of DPP-R in vivo. (A) FLI images of nude mice after being intravenously injected with DPP-R and DPP respectively for 1 h, 6 h, and 24 h. (B) FLI images and the average fluorescence intensity (C) of major organs ex-vivo. (The data were shown as mean±SD, n=3, *p<0.05).
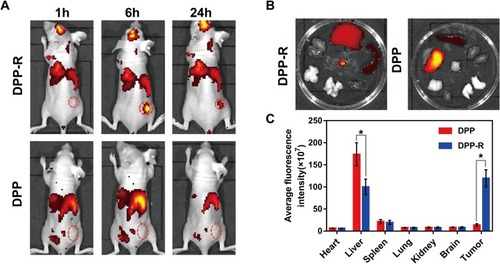
Figure 7 ADV imaging in vitro. (A) B-mode and CEUS images of DPP-R at different duration and power of LIFU. (B) Optical microscope images of phase-transition of DPP-R triggered by LIFU at a power of 8 W from 3 min to 6 min.
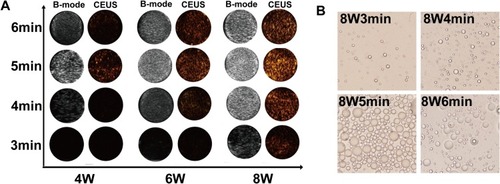
Figure 8 ADV imaging in vivo. (A) B-mode and CEUS images of orthotopic tumor-bearing mice at tumor site before and after LIFU irradiation. (B) The variation trend of the quantized mean grayscale values of B-mode and CEUS mode for different duration and power of LIFU in vitro. (C) The quantized mean grayscale values of B-mode and CEUS mode of tumor site (The data was exhibited as mean±SD, n=3, *p<0.05).
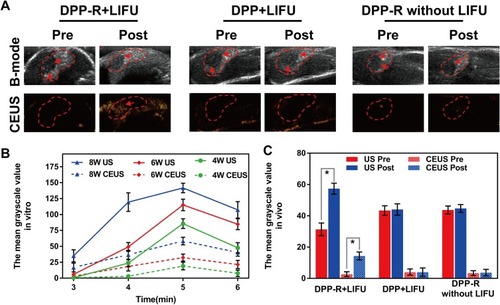
Figure 9 (A) Cell vitality of MGC-803 incubated with different formulations of different agents. (B) Body weight of orthotopic tumor-bearing nude mice in different groups during therapy period. (C) Posttreatment tumor weight and (D) tumor inhibition rate of orthotopic tumor-bearing nude mice in different groups. (The data were shown as mean±SD, n=3, *p<0.05).
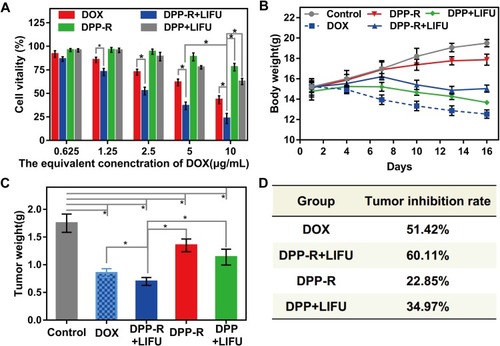
Figure 10 (A) Tumor images of orthotopic tumor-bearing nude mice in different groups after treatment. (B) H&E and TUNEL staining of tumors in different groups (×400).
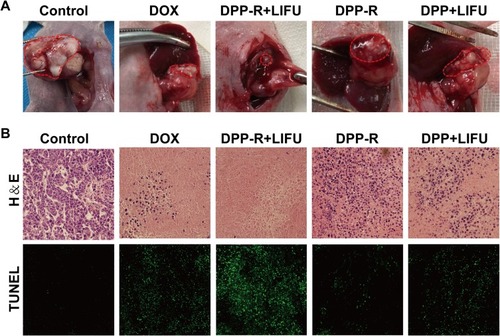
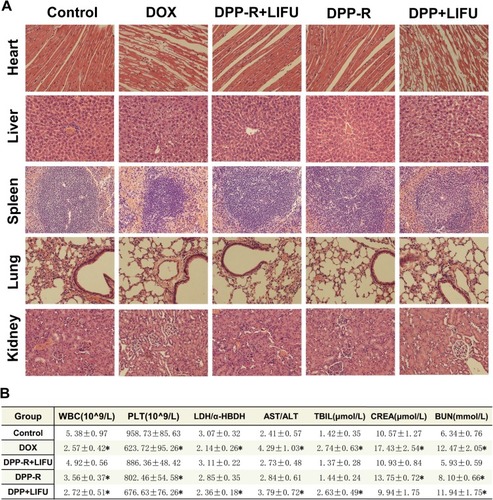
Figure 11 (A) H&E staining of major organs of nude mice in different groups after therapy. Myocardial interstitium existed vacuolar degeneration, hepatocyte swelled, hepatic cord arranged mussily and glomeruli atrophied in DOX and DPP+LIFU groups. (B) Blood indicators of different groups including hematopoietic, cardiac, hepatic and nephric function. (The data were shown as mean±SD, n=3, *p<0.05).