Figures & data
Figure 1 The characterization of CSNPs. (A) TEM image of CSNPs. (B) DLS measurements of CSNPs.
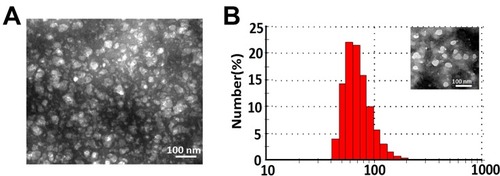
Figure 2 Immunocompatibility assays of CSNPs. (A–C) Viability of Vγ9Vδ2 T cells determined by Annexin V-FITC/PI. (D–E) The immune checkpoint molecule PD-1 expression of Vγ9Vδ2 T cells in the presence of chitosan or CSNPs. Black line represents the chitosan group, whereas red lines in (A–D) represent CSNPs group. Data were collected from at least three independent experiments. Co-incubation time between CSNPs or chitosan and cells was 6 hrs. The statistical differences were calculated by parallel comparisons of data at specific concentration points of chitosan and CSNPs (A–D); however, in (E), experimental group was, respectively, compared with control group (“0“). *p<0.05, **p<0.01, ***p<0.001, n=3.
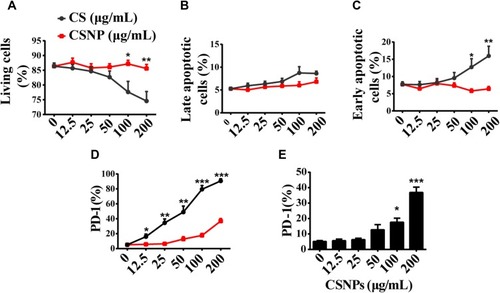
Figure 3 CSNPs promote killing associated receptor expression of Vγ9Vδ2 T cells. (A) Fluorescence profiles and mean fluorescence intensity (MFI) (B) of NKG2D expression of Vγ9Vδ2 T cells treated with CSNPs for 6 hrs. (C) The Western blot of mTOR signal pathway-related protein of Vγ9Vδ2 T cells was treated with CSNPs only or stimulated with anti-CD3, anti-CD28. (D, E) Mean fluorescence intensity (MFI) of P-4E-BP1 expression of Vγ9Vδ2 T cells. (F, G) Flow cytometry plots and Fas-L expression statistics of Vγ9Vδ2 T cells treated with CSNPs for 6, 12, and 24 hrs. (H, I) Flow cytometry plots and CD56 expression of Vγ9Vδ2 T cells stimulated with CSNPs for 6 hrs. Data were collected from at least three independent repetitions and analyzed using one-way ANOVA test or t-test (*p<0.05, **p<0.01, ***p<0.001, n=3).
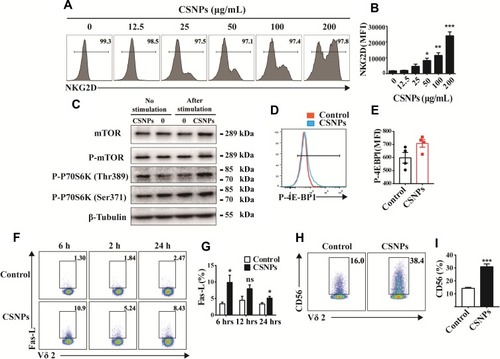
Figure 4 CSNPs induced polarization of α-tubulin and changed membrane surface nanostructure of Vγ9Vδ2 T cells. (A) Cytoskeleton (β-actin, α-tubulin) visualizations by confocal laser scanning microscopy. (B–D) Quantified analyses of α-tubulin and β-actin expression of Vγ9Vδ2 T cells by flow cytometry, showing as fluorescence intensity profiles (B) and histograms of mean fluorescence intensity (MFI) (C, D). (E) The topography and membrane surface nanostructure images of Vγ9Vδ2 T cells acquired by AFM (atomic force microscope). Upper: topography and corresponding error signal mode images, scanning size: 15 or 20 μm. Bottom: membrane surface nanostructure images, scanning size: 4 μm. (F, G) Membrane surface roughness (Ra, Rq) at the detection scale of 4 μm. Data were collected from at least three independent experiments. Statistical differences between experimental groups and the control group were analyzed using one-way ANOVA test (**p<0.01, ***p<0.001, n=3).
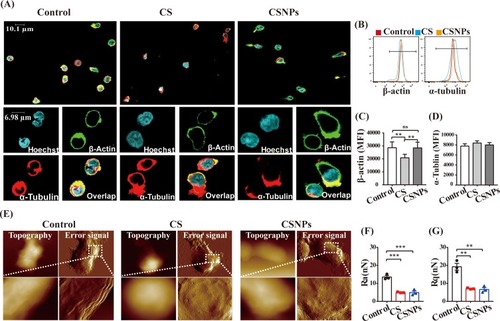
Figure 5 CSNPs had no impact on proliferation and differentiation of Vγ9Vδ2 T cells. Vγ9Vδ2 T cells were treated with 50 μg/mL CSNPs. (A) Percentage (%) and mean fluorescence intensity (MFI) of Ki67 (cell proliferation marker) expression of Vγ9Vδ2 T cells after CSNPs treatment. (B) Cell differentiation phenotype of Vγ9Vδ2 T cells after CSNPs treatment. Four cell subsets could be analyzed by gating CD45RA and CCR7 expression: γδ Tnaïve (CD45RA+, CCR7+), γδ TCM (CD45RA-, CCR7+), γδ TEM (CD45RA-, CCR7-), γδ TEMRA (CD45RA+, CCR7-). (C) Statistical analysis of cell differentiation phenotype, showing that CSNPs only enhanced the percentage (%) of naïve Vγ9Vδ2 T cells. Data were collected from at least three independent repetitions. *p<0.05, n=3.
Abbreviation: ns, no significant difference.
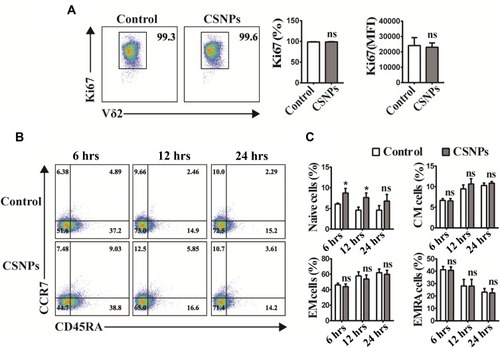
Figure 6 CSNPs specifically promoted perforin secretion of Vγ9Vδ2 T cells. (A–F) Flow cytometry plots and perforin, IFN-γ, TNF-α, CD107a, and granzyme B expression statistics of Vγ9Vδ2 T cells treated with CSNPs for 6 hrs. Data were collected from at least three independent repetitions and analyzed using T-test (*p<0.05, **p<0.01, ***p<0.001, n=3).
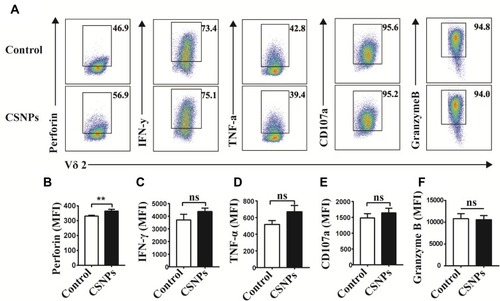
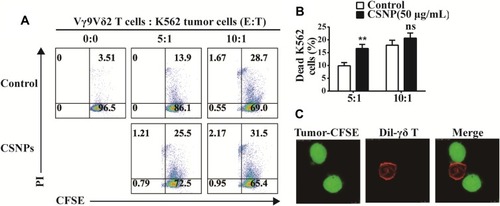
Figure 7 CSNPs strengthened tumor-killing ability of Vγ9Vδ2 T cells in vitro. (A) Killing assay of Vγ9Vδ2 T cells against K562 tumor cells using flow cytometry. (B) Statistical results based on at least three independent repetitions. (C) Representative confocal images of Vγ9Vδ2 T cells (labeled with fluorescence dye Dil) interacting with CFSE-labeled tumor cells. **p<0.01, n=3.
Abbreviation: ns, no significant difference.