Figures & data
Figure 1 Size distribution (A) and TEM image (B) of IF-7-MNC. Scale bar =200 nm.
Abbreviation: TEM, transmission electron microscopy.
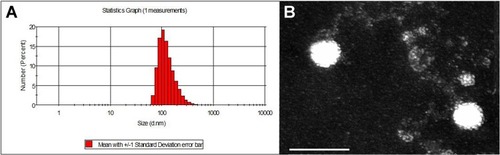
Figure 2 The change of size and zeta potential of IF-7-MNC against dilution by different buffers including (A) PBS (pH 7.4), (B) PBS (pH 6.5), and (C) PBS (pH 5.0).
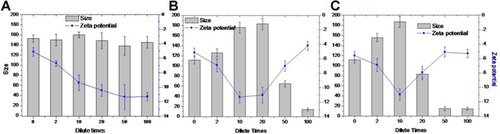
Figure 3 Release profiles of PTX from different PTX formulations in (A) PBS (0.01 M, pH 6.5) and (B) PBS (0.01 M, pH 5.0) containing 0.5% Tween 80.
Abbreviation: PTX, paclitaxel.
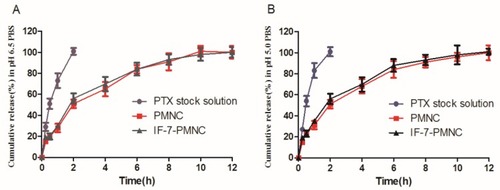
Figure 4 Qualitative and quantitative results of CMNC and IF-7-CMNC taken in by A549 cells. Cells pre-incubated with 100 μg IF-7 was served as control. (A) The cellular-uptake level of IF-7-CMNC by A549 cells was imaged at 0.5, 1, 2, and 4 hrs. Scale bar =100 μm. (B) The quantitative results of CMNC and IF-7-CMNC taken in by A549 cells analyzed by flow cytometry. (n=3). *p<0.05, **p<0.01.
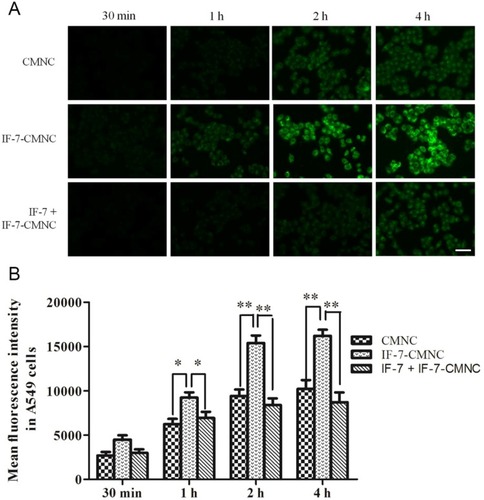
Figure 5 CMNC and IF-7-CMNC penetrated into tumor spheroids after 4 hrs incubation with the 100 ng/mL of Coumarin-6. Multi-level scan interval: 10 μm.
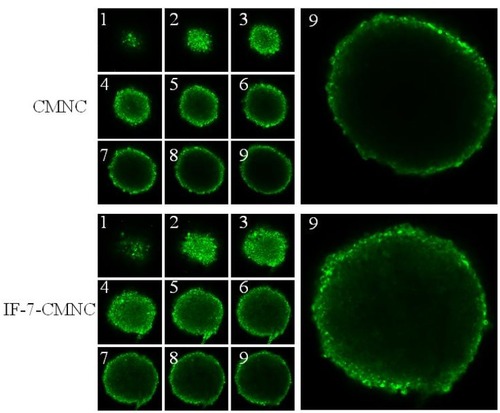
Figure 6 In vivo tumor-targeting efficacy evaluation of DMNC and IF-7-DMNC. (A) Living imaging of A549 subcutaneous tumor-bearing nude intravenously injected with Coumarin-labeled nanoclusters at 1, 2, 4, 8, 12, and 24 hrs, respectively. (B, C) Quantitative results of in vivo and ex vivo imaging.
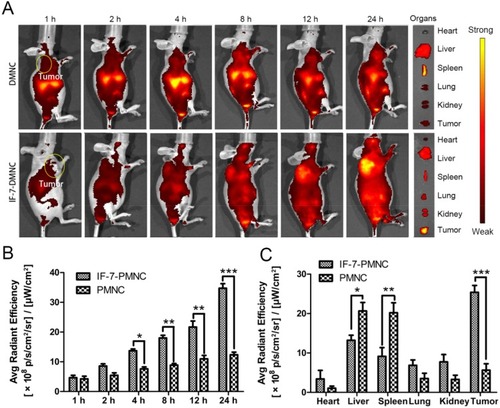
Figure 7 A549 cell viability evaluation. (A) Viability of A549 cells treated with various concentrations of blank IF-7-MNC; (B) viability of A549 cells treated with various PTX formulations, including free PTX, PMNC, and IF-7-PMNC (n=6).
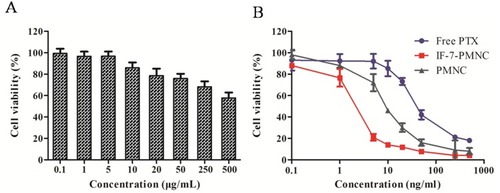
Table 1 IC50 of different PTX formulations on A549 cells (n=6)
Table 2 Anti-tumor effects of PTX formulations against A549 subcutaneous tumor in Balb/c mice (n=6)
Figure 8 Anti-tumor growth efficacy of different PTX formulations in A549 subcutaneous tumor-bearing nude mice (n=6). (A) Tumor volumes and (B) body weight of nude mice changed with time elapsed. (C) Tumor size and morphology at the experimental end point (12th day). (D) Tumor weight at the experimental end point (12th day). ***p<0.001.
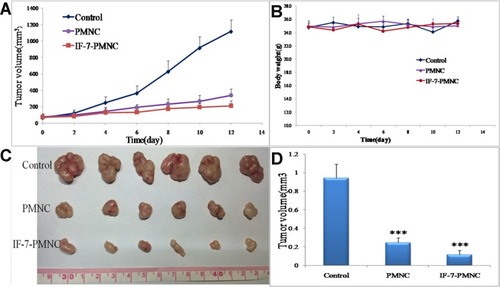
Table 3 Blood cell counts of nude mice after treatments with saline, MNC, and IF-7-MNC (n=3)
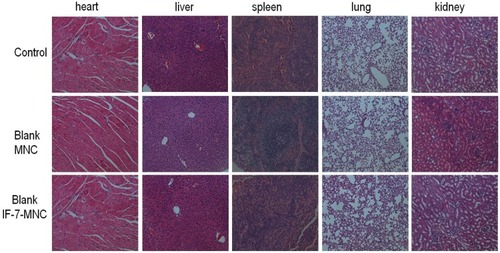
Figure 9 H&E stained heart, liver, spleen, lung, and kidney sections isolated from A549 subcutaneous tumor-bearing nude mice after treatment with saline, blank MNC and blank IF-7-MNC every 4 days 1 for three continuous times. Images were obtained by using a Lesica microscope. Original magnification: 20×.
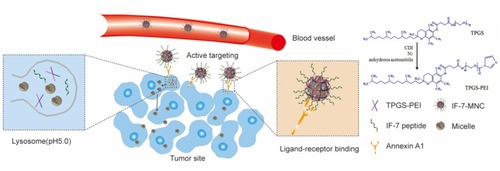
Scheme 1 A carbohydrate mimetic peptide IF-7-modified PEG-PLA/TPGS-PEI micellar nanocluster (IF-7-MNC) was prepared by emulsification−evaporation method to form the cross-link framework of TPGS-PEI to encapsulate the PEG-PLA micelles inside. IF-7 was applied as a targeting motif to bind with receptors in the tumor cells, enhancing IF-7-MNC in vivo chances of tumor accumulation and more micelles released to penetrate into tumor sites.