Figures & data
Figure 1 Schematic representation of spherical silver nanoparticles and their surface coverage: (A) 2 nm diameter AgNPs coated with GSH; (B) 2.5 nm diameter AgNPs coated with LA; (C) 3.7 nm diameter AgNPs coated with PEG-2000 Da.
Abbreviations: AgNPs, silver nanoparticles; GSH, glutathione; LA, lipoic acid.
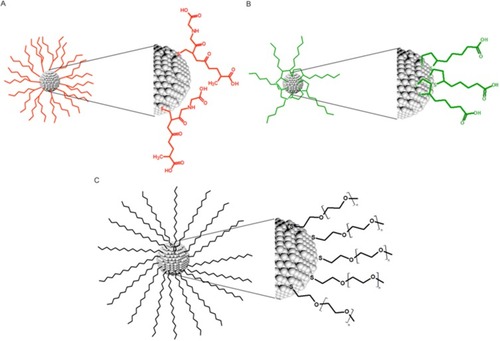
Figure 2 TEM images (top panel), histograms of NPs size distribution (middle panel), and SAXRD patterns (bottom panel): (A) AgNPs-GSH, (B) AgNPs-LA, (C) AgNPs-PEG 2000.
Abbreviations: TEM, transmission electron microscopy; NPs, nanopaticles; SAXRD, small-angle X-ray diffraction; AgNPs, silver nanoparticles; GSH, glutathione; LA, lipoic acid.
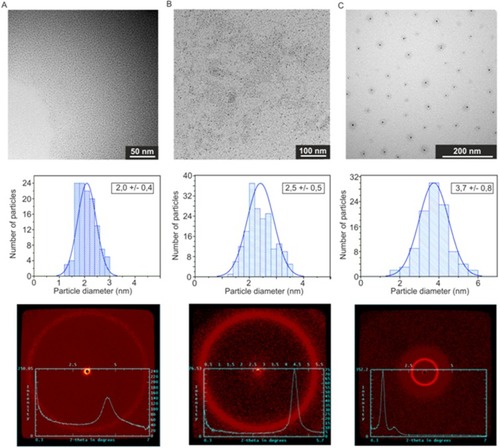
Figure 3 FTIR analysis of (A) AgNPs-GSH, (B) AgNPs-LA and (C) AgNPs-PEG.
Abbreviations: FTIR, Fourier Transform Infrared Spectroscopy; AgNPs, silver nanoparticles; GSH, glutathione; LA, lipoic acid; PEG, polyethylene glycol.
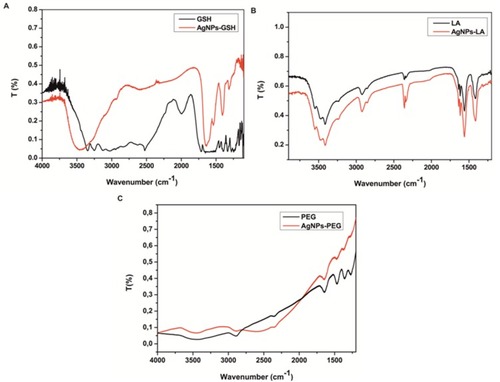
Table 1 %mass of organic and number of ligands attached to nanoparticles surface calculated from TGA analysis
Figure 4 TGA analysis for (A) AgNPs-LA; (B) AgNPs-PEG; (C) AgNPs-GSH.
Abbreviations: TGA, thermogravimetry analysis; AgNPs, silver nanoparticles; LA, lipoic acid; PEG, polyethylene glycol; GSH, glutathione.
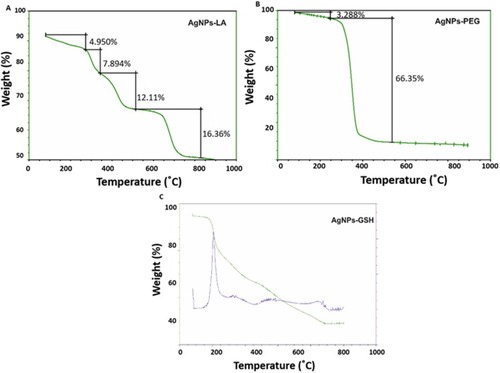
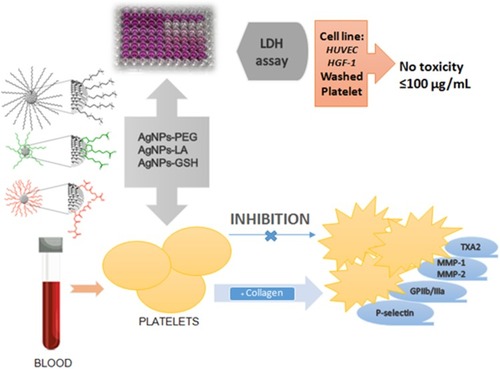
Figure 5 Measurement of the effects of AgNPs on platelet aggregation using light aggregometry and QCM-D.
Notes: (A) A representative light aggregometry tracing showing collagen (2 µg/mL)-induced platelet aggregation. (B) Perfusion of fibrinogen-coated polystyrene-coated quartz crystals with PRP in the presence of AgNPs-GSH, GSH-PEG or AgNPs-LA leads to the reduction of platelet aggregation. (C) Perfusion of fibrinogen-coated polystyrene-coated quartz crystals with PPP in the presence of AgNPs-GSH, GSH-PEG, and AgNPs-LA did not cause significant changes in frequency. Data are expressed as mean ± standard deviation; n=4 **P<0.01; ***P<0.001 vs control.
Abbreviations: AgNPs, silver nanoparticles; QCM-D, quartz crystal microbalance with dissipation; PRP, platelet-rich plasma; GSH, glutathione; PEG, polyethylene glycol; LA, lipoic acid ; PPP, platelet-poor plasma.
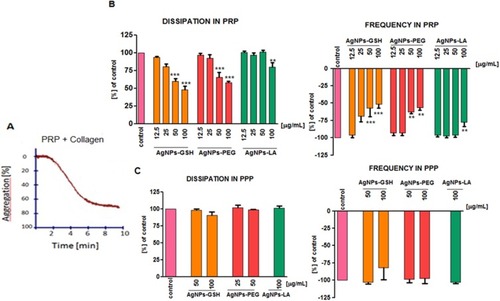
Figure 6 Effects of AgNPs on platelet aggregation as measured by QCM-D. Perfusion of sensor crystals with PRP in the presence of AgNPs-GSH, AgNPs-PEG, or AgNPs-LA (100 µg/mL) inhibited platelet aggregation.
Notes: (A) Representative tracings from the third overtone recorded by the device in the presence or absence of AgNPs (100 µg/mL) on frequency (blue line, left axis) and dissipation (red line, right axis). (B) Representative micrographs of the surface of sensors as viewed by phase contrast microscopy showing decreased accumulation of platelet aggregates in the presence of AgNPs.
Abbreviations: AgNPs, silver nanoparticles; QCM-D, quartz crystal microbalance with dissipation; PRP, platelet-rich plasma; GSH, glutathione; PEG, polyethylene glycol; LA, lipoic acid.
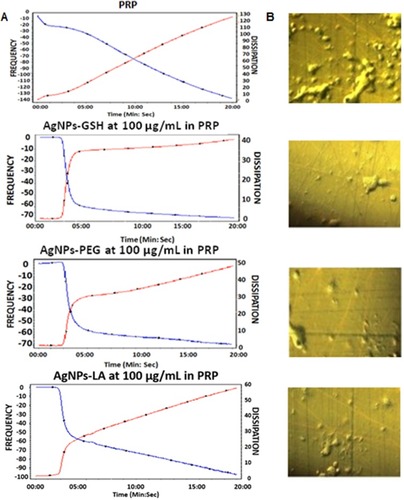
Figure 7 Effects of AgNPs on plasma protein accumulation as measured by QCM-D. In the absence of platelets (PPP) AgNPs did not cause deposition of proteins on the sensor surface. Representative traces from the third overtone recorded by the device showing effects of AgNPs (100 µg/mL) on frequency (blue line, left axis) and dissipation (red line, right axis).
Abbreviations: AgNPs, silver nanoparticles; QCM-D, quartz crystal microbalance with dissipation; PPP, platelet-poor plasma.
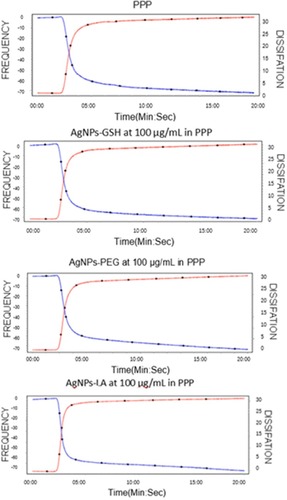
Figure 8 AgNPs do not cause LDH release from (A) washed platelets after 20 mins of incubation, (B) washed platelets, (C) HUVEC, and (D) HGF-1 cells after 24 hrs of incubation as compared with untreated WP or cells. Results are mean ± standard deviation; n=3. Lysis buffer-treated cells and WP were set to 100% (total LDH release).
Abbreviations: AgNPs, silver nanoparticles; LDH, lactate dehydrogenase; HUVEC, human umbilical vein endothelial cells; WP, washed platelet.
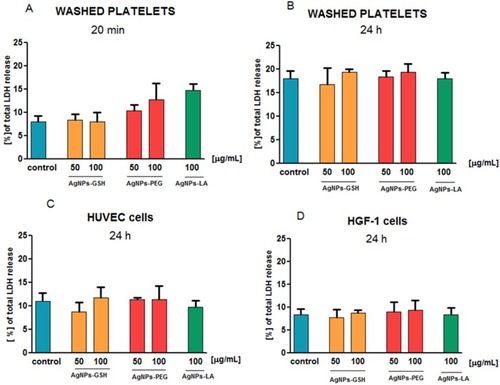
Figure 9 AgNPs-GSH. AgNPs-PEG, and AgNPs-LA attenuated collagen-stimulated increase in the abundance of P-selectin on the platelets.
Notes: (A) Representative flow cytometry recordings showing effects of AgNPs-GSH, AgNPs-PEG, and AgNPs-LA (100 μg/mL) on P-Selectin. The corresponding bar graph shows an analysis of the effects of AgNPs on (B) P-Selectin. Data are expressed as mean ± standard deviation; n=4; ***P<0.001 vs collagen-stimulated platelets or as indicated.
Abbreviations: AgNPs, silver nanoparticles; GSH, glutathione; PEG, polyethylene glycol; LA, lipoic acid.
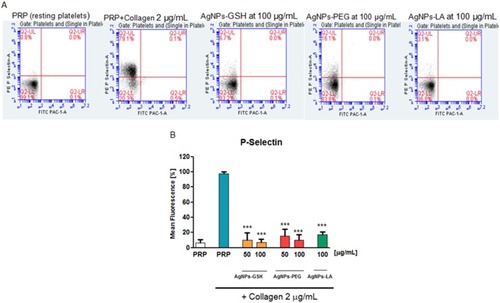
Figure 10 AgNPs-GSH. AgNPs-PEG, and AgNPs-LA attenuated collagen-stimulated increase in the abundance of GPIIb/IIIa on the platelet surface.
Notes: (A) Representative flow cytometry recordings showing effects of AgNPs-GSH, AgNPs-PEG, and AgNPs-LA (100 μg/mL) on GPIIb/IIIa. The corresponding bar graph shows analysis of the effects of AgNPs on (B) GPIIb/IIIa. Data expressed as mean ± standard deviation; n=4; ***P<0.001 vs collagen-stimulated platelets or as indicated. Abbreviations: AgNPs, silver nanoparticles; GSH, glutathione; PEG, polyethylene glycol; LA, lipoic acid.
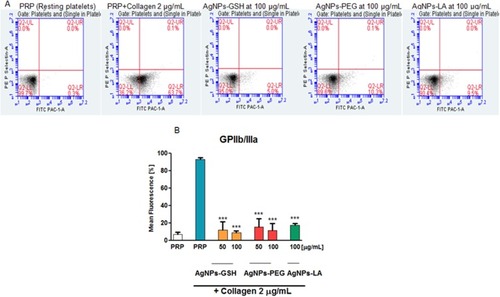
Figure 11 AgNPs-GSH, AgNPs-PEG, and AgNPs-LA decreased collagen-induced formation of TXB2 by platelets.
Notes: Data expressed as mean ± standard deviation; n=4; **P<0.01; ***P<0.001 vs collagen-stimulated platelets.
Abbreviations: AgNPs, silver nanoparticles; GSH, glutathione; PEG, polyethylene glycol; LA, lipoic acid.
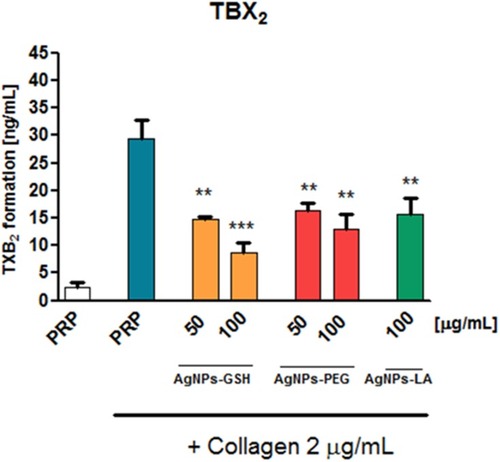
Figure 12 AgNPs-GSH, AgNPs-PEG, and AgNPs-LA attenuated collagen-induced increase of (A) MMP-1 and (B) MMP-2 levels from platelets.
Notes: Data expressed as mean ± standard deviation; n=4; *P<0.05; ***P<0.001 vs collagen-stimulated platelets or as indicated.
Abbreviations: AgNPs, silver nanoparticles; GSH, glutathione; PEG, polyethylene glycol; LA, lipoic acid.
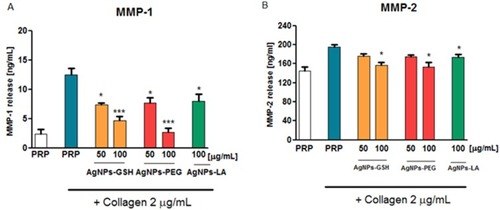
Figure 13 Effects of functionalized AgNPs on human platelet aggregation.
Abbreviation: AgNPs, silver nanoparticles.