Figures & data
Scheme 1 Schematical illustration showing the possible molecular mechanism for enhanced osteogenesis by HA-Au nanoparticles by activation of Wnt/β-catenin signaling pathway as well as internalization into the hMSCs.
Abbreviations: HA-Au, gold nanoparticles-loaded hydroxyapatite; hMSCs, human bone marrow-derived mesenchymal stem cells.
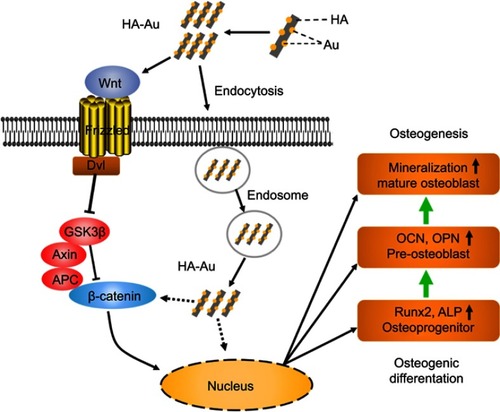
Figure 1 TEM images of (A) HA, (B) HA-Au1, and (C) HA-Au2 (scale bar, 50 nm). (D) XRD, (E) FT-IR, (F) XPS analysis of HA, HA-Au1, and HA-Au2. (G) The high-resolution spectra of Au4f for HA-Au1 and HA-Au.
Abbreviations: TEM, transmission electron microscope; HA, hydroxyapatite; HA-Au, gold nanoparticles-loaded hydroxyapatite; XRD, X-ray powder diffractometry; FT-IR, fourier-transform infrared spectroscopy; XPS, X-ray photoelectron spectroscopy.
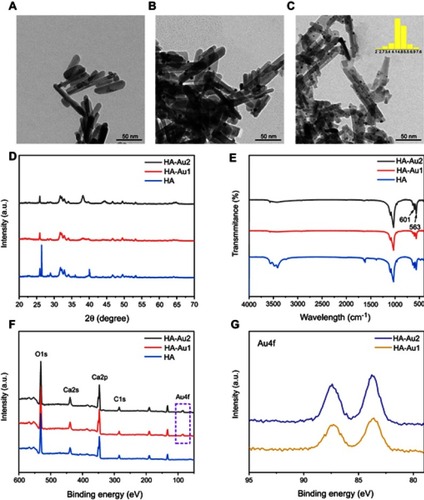
Figure 2 (A) Cell viability of hMSCs incubated with PBS (control), HA or HA-Au in growth medium at concentrations of 10, 50, 100, and 200 μg/mL for 2 days. (B) Cell proliferation of hMSCs incubated with PBS (control), HA or HA-Au in osteogenic induction medium at the concentration of 100 μg/mL for 3 and 7 days (*p<0.05, comparison between control group and other groups).
Abbreviations: hMSCs, human bone marrow-derived mesenchymal stem cells; HA, hydroxyapatite; HA-Au, gold nanoparticles-loaded hydroxyapatite.
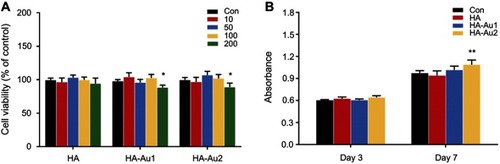
Figure 3 TEM images of HA (A, C) and HA-Au (B, D)-internalized hMSCs show that the particles can be uptaken by cells (black dots in white boxed areas in A and B (scale bar, 1 μm), with corresponding amplified images of C and D (scale bar, 500 nm).
Abbreviations: TEM, transmission electron microscope; hMSCs, human bone marrow-derived mesenchymal stem cells; HA, hydroxyapatite; HA-Au, gold nanoparticles-loaded hydroxyapatite.
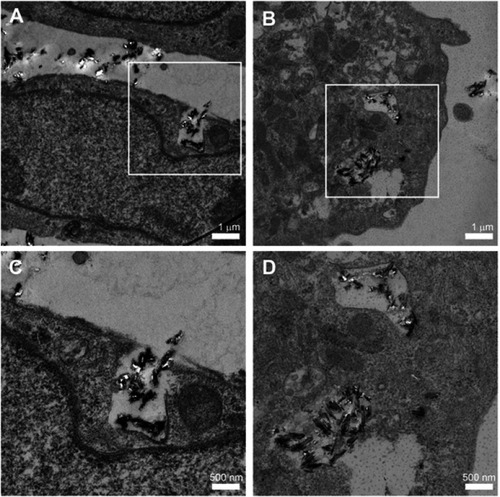
Figure 4 ALP staining (A) and ALP activity assay (B) of hMSCs after incubation with PBS (control), HA or HA-Au in osteogenic induction medium at the concentration of 100 μg/mL for 3, 7, and 14 days (scale bar: 100 μm. *p<0.05, **p<0.01, comparison between control group and other groups. +p<0.05, ++p<0.01, comparison between HA group and HA-Au group).
Abbreviations: ALP, alkaline phosphatase; hMSCs, human bone marrow-derived mesenchymal stem cells; PBS, phosphate buffer saline; HA, hydroxyapatite; HA-Au, gold nanoparticles-loaded hydroxyapatite.
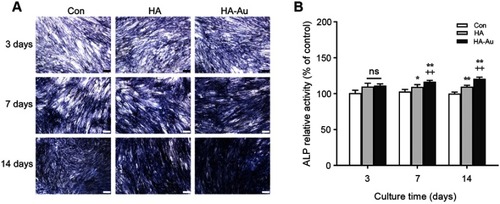
Figure 5 ARS staining (A) and calcium deposition assay (B) of hMSCs after incubation with PBS (control), HA or HA-Au in osteogenic induction medium at the concentration of 100 μg/mL for 14 and 21 days. (scale bar: 100 μm. *p<0.05, **p<0.01, comparison between control group and other groups. +p<0.05, ++p<0.01, comparison between HA group and HA-Au group).
Abbreviations: ARS, Alizarin Red S; hMSCs, human bone marrow-derived mesenchymal stem cells; PBS, phosphate buffer saline; HA, hydroxyapatite; HA-Au, gold nanoparticles-loaded hydroxyapatite.
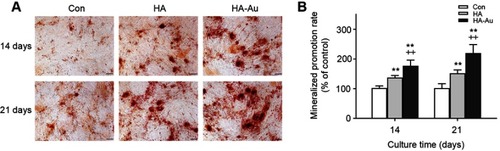
Figure 6 The expression of osteogenic differentiation specific genes in hMSCs after incubation with PBS (control), HA or HA-Au in osteogenic induction medium at the concentration of 100 μg/mL for 3 and 7 days: ALP (A), Runx2 (B), COL1 (C), BSP (D), OCN (E) and, OPN (F). (*p<0.05, **p<0.01, comparison between control group and other groups. +p<0.05, ++p<0.01, comparison between HA group and HA-Au group).
Abbreviations: hMSCs, human bone marrow-derived mesenchymal stem cells; PBS, phosphate buffer saline; HA, hydroxyapatite; HA-Au, gold nanoparticles-loaded hydroxyapatite; ALP, alkaline phosphatase; Runx2, runt-related transcription factor 2; COL1, collagen typeⅠ; BSP, bone sialoprotein; OCN, osteocalcin; OPN, osteopontin.
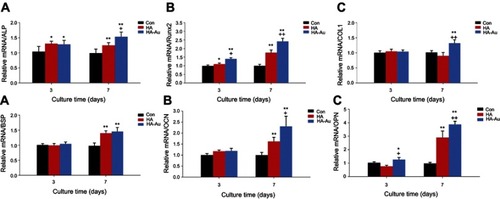
Figure 7 Western blot and RT-PCR results showed that HA-Au increased the expression of β-catenin and β-catenin target gene axin-2 in hMSCs (A–D). Meanwhile, β-catenin and axin-2 expression levels were significantly reduced when ICG-001 was added (E–H). (*p<0.05, **p<0.01, comparison between control group and other groups).
Abbreviations: RT-PCR, real-time polymerase chain reaction; hMSCs, human bone marrow-derived mesenchymal stem cells; HA, hydroxyapatite; HA-Au, gold nanoparticles-loaded hydroxyapatite.
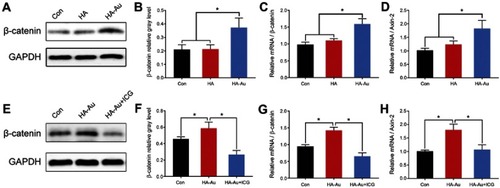
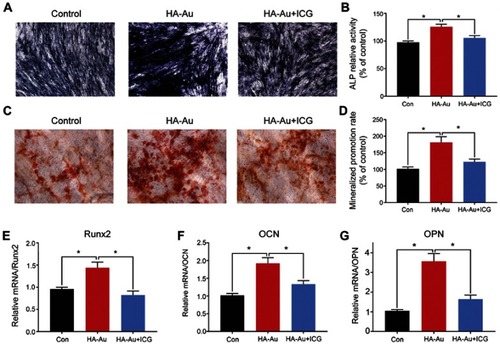
Figure 8 Wnt/β-catenin inhibitor reversed effects of HA-Au on osteogenic differentiation of hMSCs. hMSCs osteogenic differentiation was assessed by ALP staining (A, B) and ARS staining (C, D) after culture for 7 and 21 days, respectively. The mRNA levels of Runx2 (E), OCN (F) and OPN (G) were determined by RT-PCR. (*p<0.05, **p<0.01, comparison between the control group and other groups).
Abbreviations: hMSCs, human bone marrow-derived mesenchymal stem cells; HA, hydroxyapatite; HA-Au, gold nanoparticles-loaded hydroxyapatite; ALP, alkaline phosphatase; ARS, Alizarin Red S; Runx2, runt-related transcription factor 2; OCN, osteocalcin; OPN, osteopontin; RT-PCR, real-time polymerase chain reaction.