Figures & data
Figure 1 TEM images of magnetoliposomes (MLs). (A) anionic MLs, (B) c-RGD MLs. Note the covering around the nanoparticles (phospholipidc bilayer). Scale bar (A) =200 nm. (B) =200 nm.
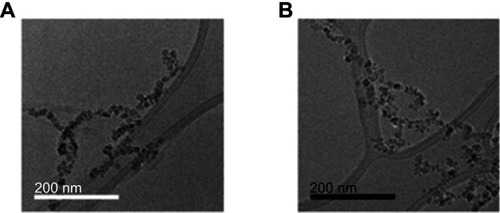
Figure 2 Magnetic resonance imaging (MRI) of mice injected with magnetolipsomes (MLs) (A) Representative in vivo MRI (T2-weighted RARE) before and 2, 4, 24 and 48h post-injection of cRGD-MLs and anionic MLs. Red arrows point to hypointense areas of signal changes, indicating uptake of RGD-MLs. (B) Quantification of the T2 values based on parametric T2 maps acquired by multi slice-multi echo MRI. Significant differences were detected between animals injected with cRGD-MLs and anionic MLs. Data are presented as mean ± SD (two-way ANOVA). **p<0.01, ***p<0.001, ****p<0.0001 vs baseline (n=9 animals/group).
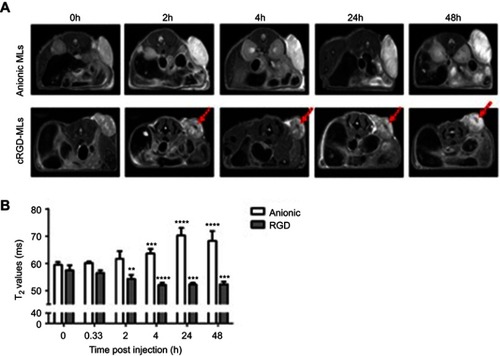
Table 1 Characterization of anionic and RGD-functionalized magnetoliposomes (MLs) by dynamic light scattering
Figure 3 Fluorescence imaging (FLI) of mice injected with magnetoliposomes (MLs). (A) Representative in vivo FLI images before and 2, 4, 24 and 48 h post-injection of cRGD-MLs and anionic MLs. (B) Quantification of the total radiant efficiency based on FLI data. There is a significant difference between cRGD-ML and anionic ML injected animals. Data are presented as mean ± SD (Two-Way ANOVA). ***p<0.001, ****p<0.0001 vs baseline (n=3/group, except RGD-group for FLI: n=4). (C) Quantification of the total radiant efficiency of tumor region ex vivo, comparing the tumor with a control region of cRGD-ML and anionic-ML injected animals 2h, 4h and 48h after injection. *p<0.05 compared to 2h group (n=3 animals p/group). No results are shown for the group that received anionic MLs at 48h due to acquisition problems.
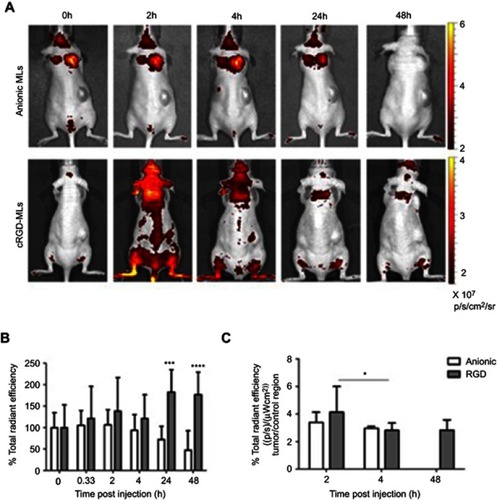
Table 2 MLs uptake in SKOV-3 xenografts at the different time points of the experiment
Figure 4 Ex vivo electron paramagnetic resonance spectroscopy (EPR). (A) Quantification of the total iron concentration [Fe] in the tumor tissue by EPR spectroscopy over-time (h= hours). Data are presented as mean ± SD (two-way ANOVA), (n=3 animals p/group). (B) Quantification of the total iron concentration in the tumor tissue of cRGD, anionic magnetoliposomes (MLs) and control (Ctrl) animals by EPR spectroscopy, in comparison with liver and spleen (excretion route) 2h after injection of the MLs. Data are presented as mean ± SD (two-way ANOVA).
![Figure 4 Ex vivo electron paramagnetic resonance spectroscopy (EPR). (A) Quantification of the total iron concentration [Fe] in the tumor tissue by EPR spectroscopy over-time (h= hours). Data are presented as mean ± SD (two-way ANOVA), (n=3 animals p/group). (B) Quantification of the total iron concentration in the tumor tissue of cRGD, anionic magnetoliposomes (MLs) and control (Ctrl) animals by EPR spectroscopy, in comparison with liver and spleen (excretion route) 2h after injection of the MLs. Data are presented as mean ± SD (two-way ANOVA).](/cms/asset/50953a56-5a40-4d74-bdb1-bebb7304295e/dijn_a_12191060_f0004_b.jpg)
Figure 5 Hematoxylin and eosin stainings of tumors. Representative complete overviews of the histological sections of tumors derived from animals injected with either anionic magnetoliposomes (MLs) (A) or cRGD-MLs (B). (C) is an amplification of (B). The blue “dots” in the tumor, indicate the presence of Fe and are caused by the targeted uptake of cRGD-MLs. This signal is absent in the control tumors. Scale bar (A, B) =500 µm. Scale bar (C) =200 µm.
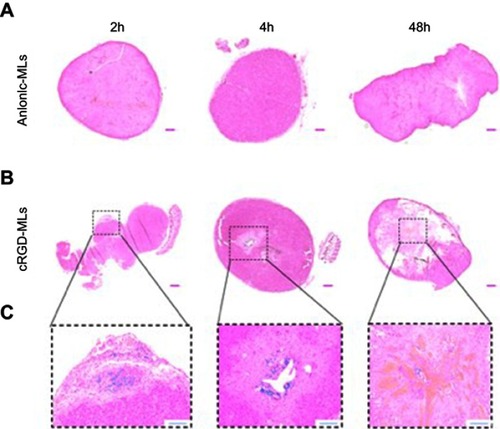
Figure S1 Schematic representation of RGD functionalized magnetoliposomes synthesis procedure. The RGD peptide was linked via a sulfhydryl (-SH) group of the cysteine in the cyclic-RGD peptide that couples to the maleimide groups at the distal end of the DSPE-PEG-MAL group. The liposome suspension was incubated with cyclic RGD peptide at a molar ratio of 10:1 overnight.
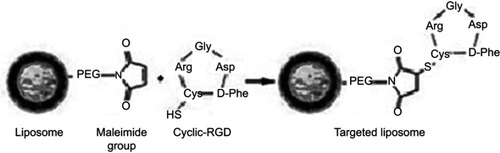
Figure S2 Experimental outline of the in vivo imaging experiments. Two separate groups of animals were used for the fluorescence imaging (FLI) and Magnetic Ressonance Imaging (MRI) experiments.
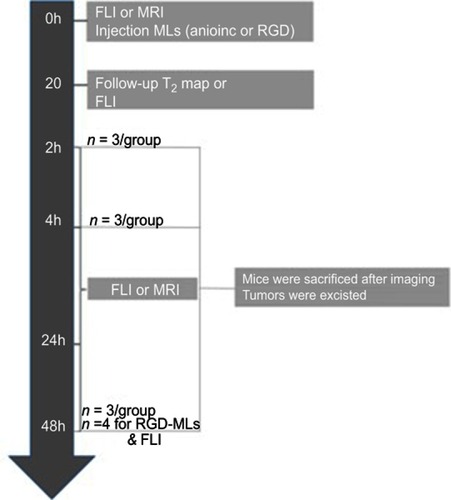
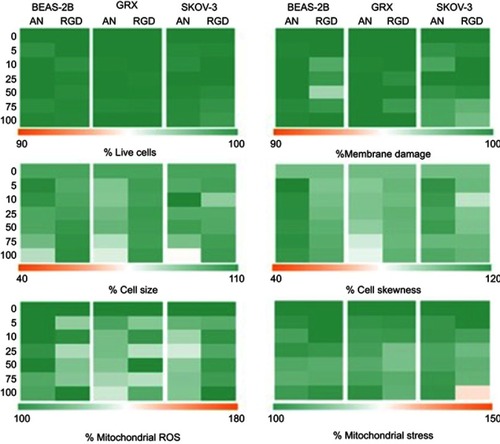
Figure S3 Representation of high content image analysis for (A) cell viability, (B) membrane damage, (C–D) cell morphology (cell size and skewness) and (E–F) mitochondrial ROS formation and stress levels for BEAS-2B, GRX and SKOV-3 cells labeled with increasing concentrations of anionic (AN) and cRGD-MLs for 24 h via color-coded heat maps. Data are presented as mean ± SD vs control. Acquired data were analyzed using two-way ANOVA. No significance difference was found after incubating the cells with either anionic or RGD-MLs.