Figures & data
Figure 1 Schematic illustration of polymers' self-assembly for targeting delivery of BSH and DOX into cancer cells. (A) Synthetic scheme of iRGD-PEG-PCCL-B/DOX. (B) The working mechanism of the iRGD-mediated transport pathway.
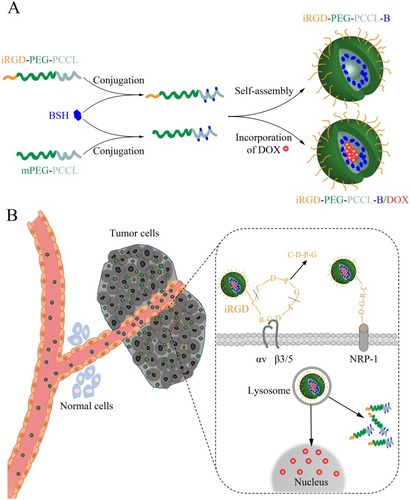
Figure 2 Synthetic scheme for the preparation of (A) monomer, (B) mPEG-PCCL-B, and (C) iRGD-PEG-PCCL-B.
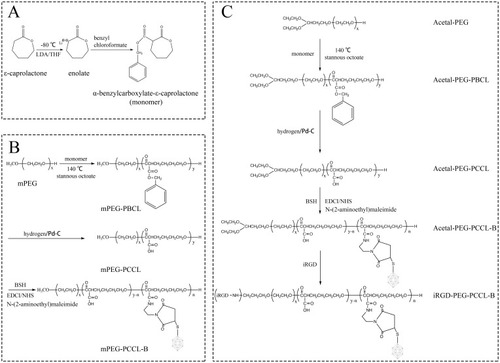
Table 1 Properties Of iRGD-PEG-PCCL-B/DOX Polymers
Figure 3 Characteristics of iRGD-PEG-PCCL-B/DOX polymers. (A) Size distribution and (B) TEM image of the polymeric nanoparticles. Scale bar = 50 nm.
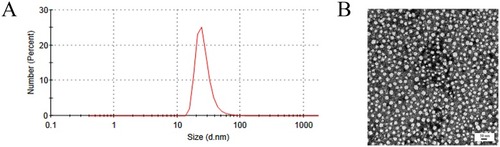
Figure 4 Biocompatibility assessment of formations. (A, B) Evaluation of cell viability (CCK-8 assay) of A549 cell lines after 48 hrs of treatment with drugs in particle form or in solution, respectively. Values are expressed as mean ± SD (n = 6). (C) Hemolytic effect was estimated by incubating 1.5% (v/v) rabbit erythrocytes with various gradient concentrations of mPEG-PCCL-B or iRGD-PEG-PCCL-B for 4 hrs at 37°C. And, physical observation of the supernatant after mPEG-PCCL-B (D) or iRGD-PEG-PCCL-B (E) addition and centrifugation was shown. Extreme values (100% and 0) are positive control (0.2% Triton X-100, D–H and E–H) and negative control (pH 7.4 PBS, D–A and E–A). Samples B–G in (D) and (E) represented the gradient concentrations (0.16 ~ 5 mg/mL) of polymers.
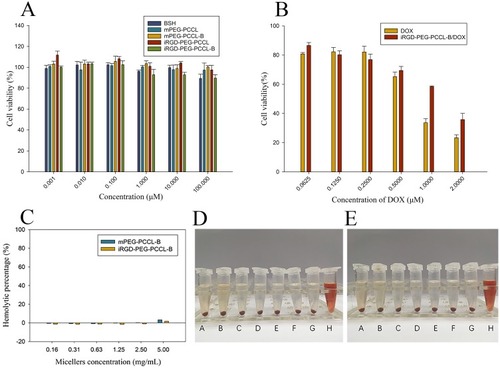
Figure 5 Visualization and graph-based quantification of intracellular DOX. (A) Confocal fluorescence images of A549 cells localization of DOX 2 hrs post-incubation at the equivalent DOX dose of 0.5 μg/mL. Blue fluorescence signifies positive staining of DAPI and DOX is shown in red. Scale bar = 60 μm. (B) Quantified intensities (average optical density) of DOX signal by ImageJ ver 1.50i. Values are expressed as mean ± SD. ## P < 0.01 vs mPEG-PCCL-B/DOX group.
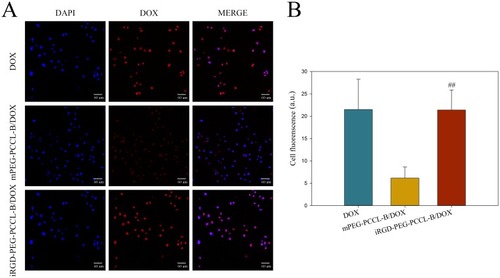
Figure 6 Time-lapse confocal images of A549 and B16F10 cells that had been incubated with the DOX solution or the iRGD-PEG-PCCL-B/DOX formulations (1 μg/mL equivalent DOX) for 2, 4, and 8 hrs. DAPI is shown in blue, and DOX in red. Scale bar = 20 μm.
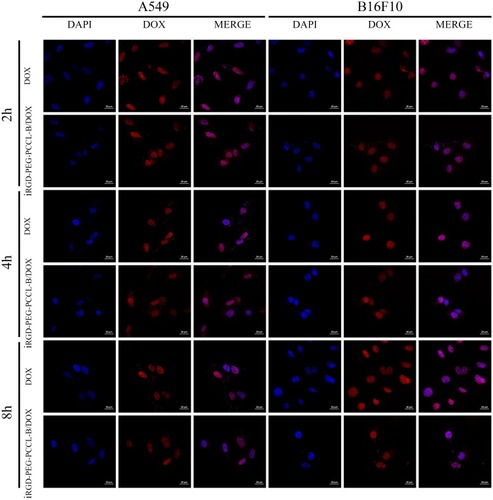
Figure 7 Time-lapse confocal images of A549 and B16F10 cells that have been incubated with the 2-butyl(4-aminohexyl)-6-(dimethylamino)-1H-benz[de]isoquinoline-1,3(2H)-dione-labeled iRGD-PEG-PCCL polymers for 2, 4, and 8 hrs. Lyso-Tracker Red were used to mark lysosomes (red fluorescence), and labeled iRGD-PEG-PCCL fluorescence is blue. The white arrows show the locations of blue fluorescence in the central region of cells. Scale bar = 20 μm.
![Figure 7 Time-lapse confocal images of A549 and B16F10 cells that have been incubated with the 2-butyl(4-aminohexyl)-6-(dimethylamino)-1H-benz[de]isoquinoline-1,3(2H)-dione-labeled iRGD-PEG-PCCL polymers for 2, 4, and 8 hrs. Lyso-Tracker Red were used to mark lysosomes (red fluorescence), and labeled iRGD-PEG-PCCL fluorescence is blue. The white arrows show the locations of blue fluorescence in the central region of cells. Scale bar = 20 μm.](/cms/asset/6589b15c-9b64-4dad-9014-a3293aace883/dijn_a_12191062_f0007_c.jpg)
Figure 8 Intracellular boron uptake of the BSH solution or the polymers containing BSH. A549 cells were incubated for 8 hrs in the presence of each boroned polymers or BSH at the dose of 20 μg/mL on a boron basis, then digested and their boron concentration were measured by ICP-MS. The data are expressed as mean ± SD (n = 3). ***P < 0.001 vs BSH group, # P < 0.05 vs mPEG-PCCL-B group.
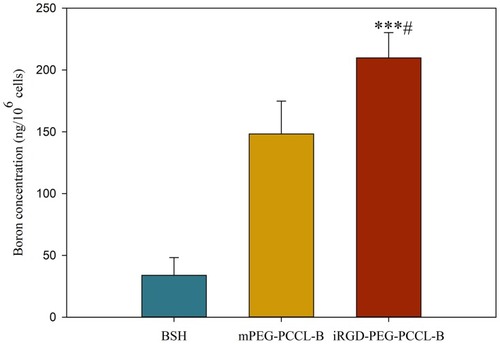
Figure 9 Expressions and quantifications of integrin αv/β3/β5 and neuropilin-1 proteins in several cell lines (B16F10, C6, 4T1, Hela, and A549). (A) Representative Western blot diagram of the selected proteins in different cell lines. (B) Western blot-based quantifications of the chosen protein expressions in various cell lines. The results are expressed as mean ± SD (n = 3).
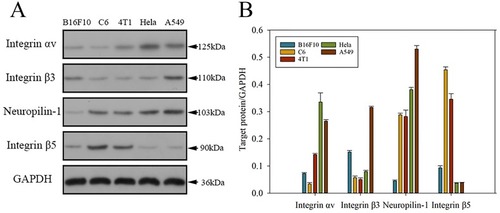
Figure 10 Blood pharmacokinetics and tissue distribution of BSH and BSH-conjugated polymers. Boron concentrations (%ID/g of tissue) in (A) blood, (B) tumor, and (C) muscle tissue were evaluated on A549 subcutaneous tumor-bearing nude mice at 6, 12, and 24 hrs after intravenous administration of BSH or BSH-conjugated polymers (20 mg/kg on a boron basis). (D) Tumor to blood distribution ratio of boron after injection of BSH or BSH-conjugated polymers. (E) Tumor to muscle distribution ratio of boron after injection of BSH or BSH-conjugated polymers. The results are expressed as mean ± SD (n = 3). **P < 0.01, ***P < 0.001.
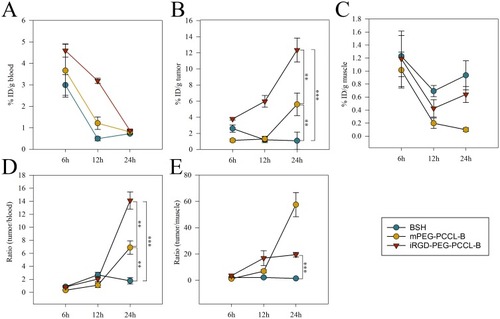
Figure 11 Biodistribution of DOX at 24 hrs after intravenous administration of various formations (2 mg/kg equivalent DOX) in nude mice bearing A549 tumors. (A) Fluorescence images were obtained over the scarified organs. The signal intensities were denoted by the respective color bar. (B) DOX concentrations in tumor were quantified by M5 Multi-Mode Plate Reader. The data are expressed as mean ± SD (n = 3). *P < 0.05, ***P < 0.001.
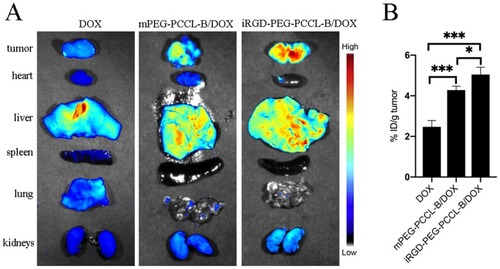
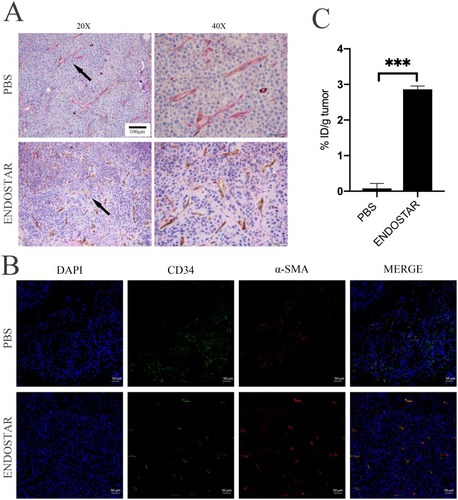
Figure 12 The effect on the tumor following either PBS or Endostar administration in mice bearing B16F10 tumors. (A) Immunohistochemistry of tumor tissues. The vascular mimicries (top arrow) are PAS+ and show purple, while the endothelium-dependent vessels (bottom arrow) are CD34+ and show brown. Original magnification: 20X and 40X. (B) Immunofluorescence staining for CD34 and α-SMA in tumor tissues. The tumor tissues were also incubated with DAPI to show blue fluorescence. The degree of overlap of CD34 and α-SMA indicates vascular maturity. Scale bar = 50 μm. (C) Boron concentrations in tumor were evaluated at 24 hrs after intravenous administration of iRGD-PEG-PCCL-B (20 mg/kg on a boron basis). The data are expressed as mean ± SD (n = 3). ***P < 0.001.