Figures & data
Figure 1 Schematic illustration of the fabrication of nanofibrous membrane, and the implantation of the membrane-wrapped autograft tendon into femur and tibia bone in ACL reconstruction surgery.
Abbreviations: SDF-1α, stromal derived factor-1α; BMP-2, bone morphogenetic protein-2; ACL, anterior cruciate ligament.
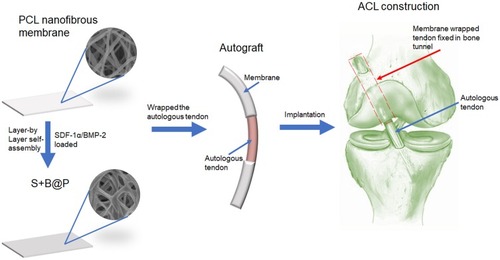
Table 1 Sample Abbreviations Used in This Work
Figure 2 A diagrammatic representation of the procedure of ACL injury modeling and reconstruction surgery.
Notes: (A) Both ends of the autograft (Partial Achilles tendon) were wrapped using the membrane for ACL reconstruction; The procedure of modeling and reconstruction: (B) The ACL tendon was exposed; (C) The ACL tendon tissue was damaged to formatted an ACL injury; (D) & (E) ACL reconstruction using the membrane wrapped autograft.
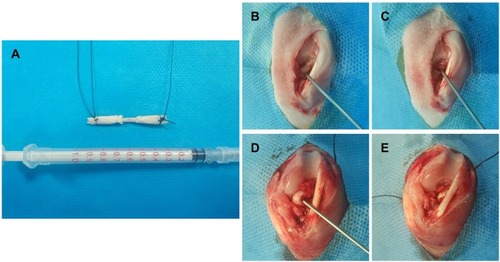
Figure 3 Characterization of PCL, B@P and S+B@P.
Notes: (A) SEM image and nanofiber diameter distribution; (B) TEM images of the microstructure of nanofibers of PCL, B@P and S+B@P; (C) ATR-FTIR and (D) UV-vis analysis of PCL, B@P and S+B@P; (E) water contact angle curves decaying with time; (F) Live images of water droplets as a function of contact time; (G) In vitro SDF-1α and BMP-2 release profile from S+B@P; (H) In vitro BMP-2 release profile from B@P.
Abbreviations: SEM, scanning electron microscope; TEM, transmission electron microscope; ATR-FTIR, attenuated total reflection flourier transformed infrared spectroscopy; UV-vis, UV-visible spectrophotometer.
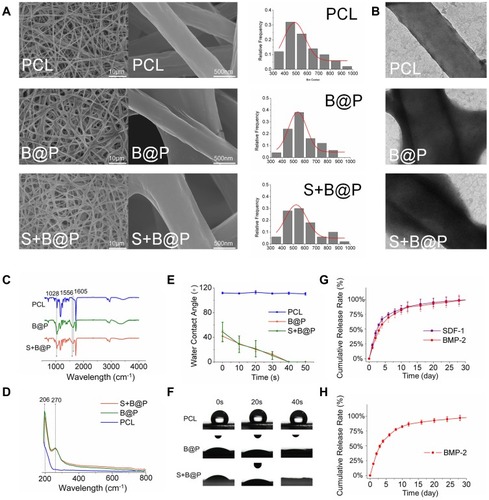
Figure 4 In vitro testing of BMSCs after cultured on each membrane (PCL, B@P and S+B@P).
Notes: (A) SEM images of BMSCs cultured on the membranes for 24 h; (B) ALP staining images; (C) ARS staining images; (D) Cell viability of BMSCs cultured on the membranes as a function of culturing time; (E) Quantitative analysis of recruited cells based on Transwell; (F) Quantitative analysis of ALP; (G) Quantitative analysis of mineralized deposition based on ARS staining. (*P<0.05).
Abbreviations: BMSCs, bone marrow mesenchymal stem cells; ALP, Alkaline phosphatase; ARS, Alizarin red staining.
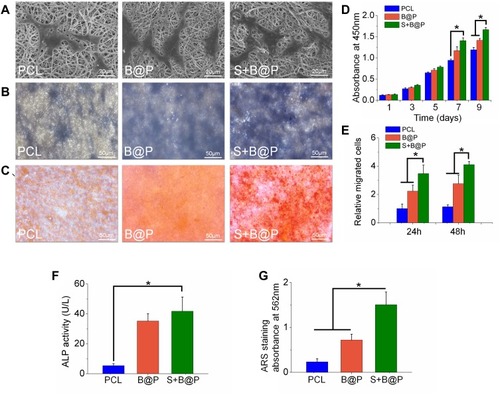
Figure 5 Quantitative PCR analysis.
Notes: The expression of osteogenic differentiation related genes, Runx2 (A), ALP (B); OCN (C) and OPN (D) were detected by Q-PCR after culturing BMSCs on the membranes for 7 and 14 days. (*P<0.05).
Abbreviations: Runx2, runt-related transcription factor 2; Col I, collagen I; OPN, osteopontin; OCN, osteocalcin.
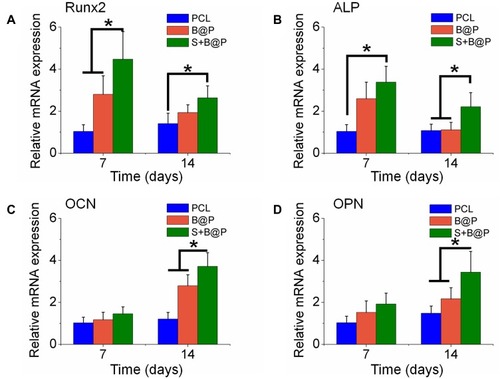
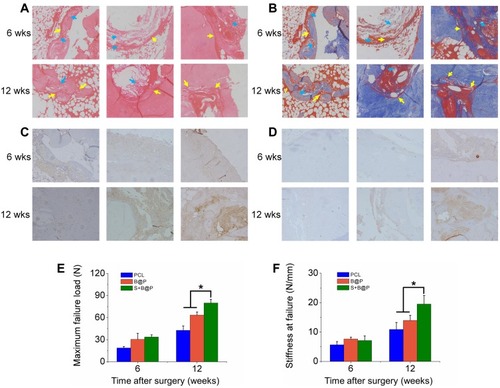
Figure 6 Analysis on histology and biomechanical features.
Notes: (A) H&E and (B) Masson’s staining of autograft tendon-bone interface 6 or 12 weeks after ACL reconstruction surgery in a rabbit model (blue arrow: undegraded membrane; yellow arrow: autograft tendon-bone interface); (C) Immunohistochemistry staining of OCN; (D) Immunohistochemistry staining of OPN; (E) Maximal failure force and (F) stiffness of tendon-bone interface. (*P< 0.05).
Abbreviations: H&E, hematoxylin-eosin; 6 wks, 6 weeks after surgery; 12 wks, 12 weeks after surgery.