Figures & data
Figure 1 Schematic and structural illustration of the synthetic pathway in preparation of PVCL-DOX nano-hydrogel.
Abbreviations: PVCL, poly(N-vinylcaprolactam); DOX, doxorubicin.
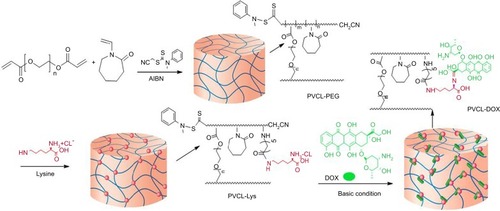
Figure 2 1HNMR spectra of PVCL-PEG and PVCL-Lys.
Abbreviations: PVCL, poly(N-vinylcaprolactam); PEWG, poly(ethylene glycol).
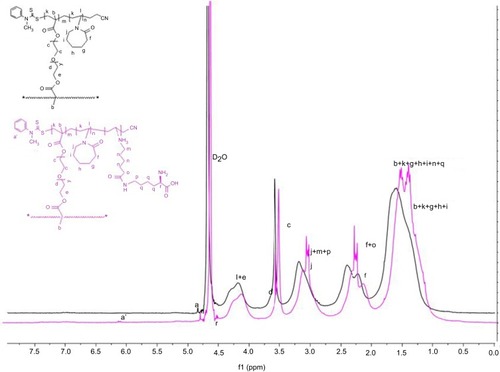
Figure 3 TEM image of PVCL-Lys at (A) room temperature (<LCST) and (B) at 42°C (>LCST).
Abbreviations: TEM, transmission electro microscopy; PVCL, poly(N-vinylcaprolactam); LCST, lower critical solution temperature.
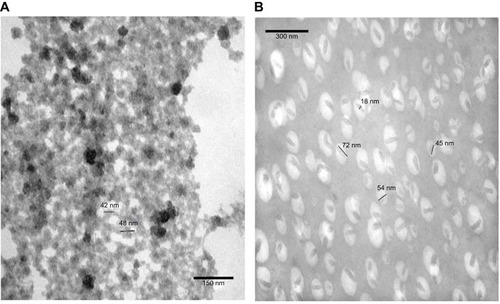
Figure 4 Cryo TEM image of PVCL-Lys nano-hydrogel.
Abbreviations: TEM, transmission electro microscopy; PVCL, poly(N-vinylcaprolactam).
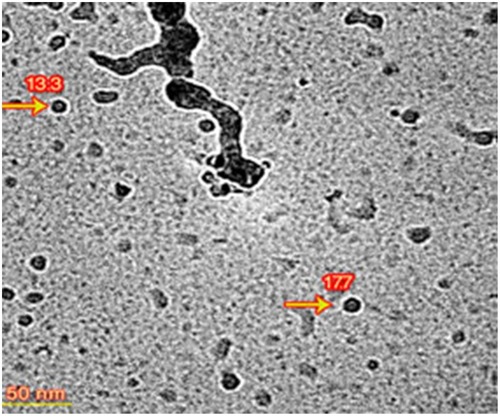
Figure 5 Release profile of PVCL-DOX in regard to temperature and pH changes.
Abbreviations: PVCL, poly(N-vinylcaprolactam); DOX, doxorubicin.
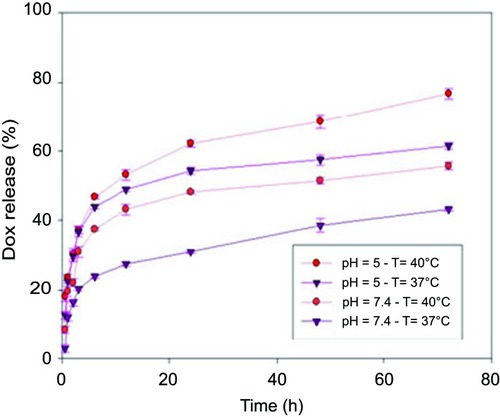
Figure 6 MTT Cytotoxic assay regarding different concentrations of free DOX, PVCL-Lys and PVCL-DOX on MCF-7 cell line (*P<0.05). (A and B) Cytotoxicity assessment of free DOX and PVCL-DOX with equal DOX concentration of free DOX in 24 hrs and (B) 48 hrs. (C) Cytotoxicity assessment of PVCL-Lys in 24 and 48 hrs.
Abbreviations: DOX, doxorubicin; PVCL, poly(N-vinylcaprolactam).
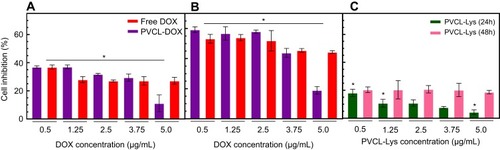
Figure 7 MCF-7 cellular uptake assessment; images of confocal laser scanning microscopy after 24 and 48 hrs treatment of (A and D) DOX with three different concentrations (I: 1.2 µg/mL, II: 0.6 µg/mL, III:0.3 µg/mL), (B and E) PVCL-DOX and (C and F) PVCL-Rhod with three different concentrations (I: 60 µg/mL, II: 30 µg/mL, III: 15 µg/mL).
Abbreviations: DOX, doxorubicin; PVCL, poly(N-vinylcaprolactam).
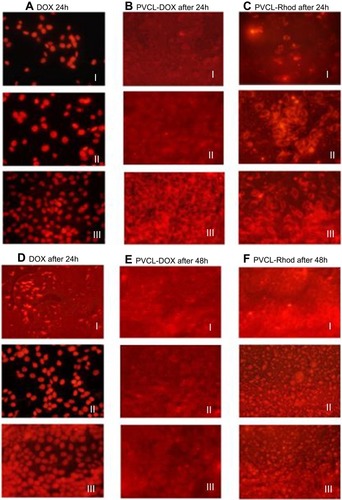
Figure 8 Histogram plots of flowcytometry analysis of the treated MCF-7 cells with DOX, PVCL-DOX, and PVCL-Rhod 4, 24, and 48 hrs. (A) The gray, green, red, and blue plots belong to the untreated cells, III:0.3, II:0.6, and I:1.2 µg/mL concentrations of DOX, respectively. (B and C) The gray, green, red, and blue plots belong to the untreated cells, III:15, II:30, and I:60 µg/mL concentrations of PVCL-DOX and PVCL-Rhod, respectively.
Abbreviations: DOX, doxorubicin; PVCL, poly(N-vinylcaprolactam).
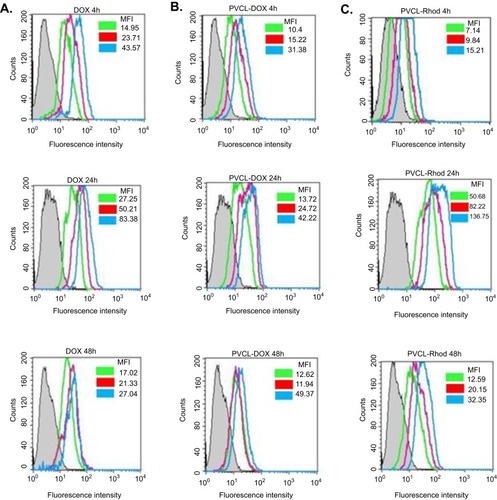
Figure S1 FT-IR spectra of PVCL-PEG and PVCL-Lys.
Abbreviations: PVCL, poly(N-vinylcaprolactam); PEWG, poly(ethylene glycol).
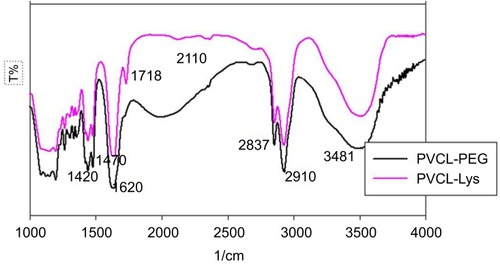
Figure S2 DSC graph of PVCL-PEG and PVCL-Lys.
Abbreviations: PVCL, poly(N-vinylcaprolactam); PEWG, poly(ethylene glycol); DSC, differential scanning calorimetry.
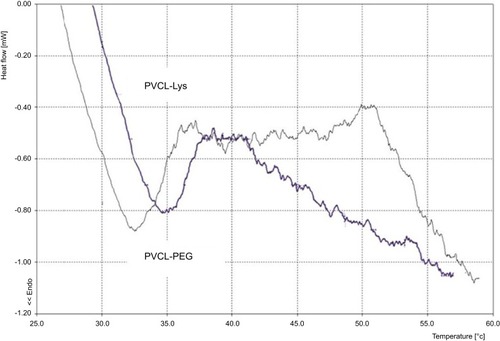
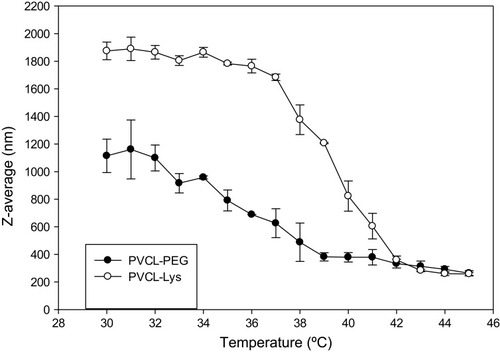
Figure S3 Dynamic light scattering (DLS) records according to Z-average (nm) changes in regard to temperature rise (1°C) and ranges between 30 and 45°C