Figures & data
Figure 1 Synthesis scheme for hyaluronic acid–acrylate (HA-AC) (A) and the results of NMR (B). a:-CH3, b:-CH2-CO-, c:-CH2, and d: -CH.
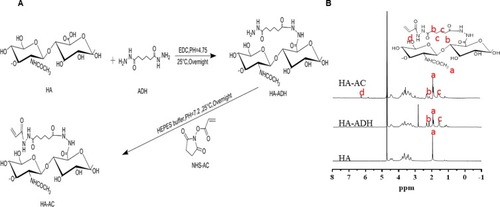
Figure 2 Schematic illustration showing the process for preparation of NanoIGUR (A); the process for preparation of NanoIGUR-loaded hydrogel (B); and the solidification process of NanoIGUR-loaded hydrogel and the administration of subcutaneous injection of NanoIGUR-loaded hydrogel to the collagen-induced arthritis (CIA) rat (C).
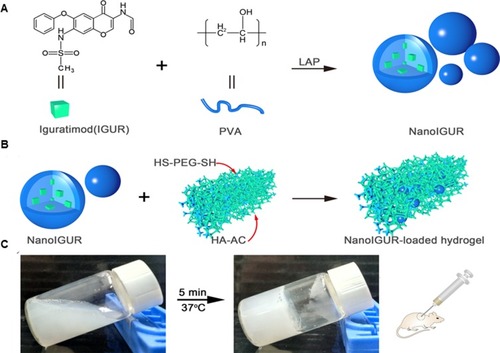
Figure 3 Characterization of NanoIGUR and NanoIGUR-loaded hydrogel. Transmission electron microscopy images of NanoIGUR (A); Differential light scattering analyses of NanoIGUR (B); DMTA of the hydrogel in the frequency range of 0.01 Hz to 10 Hz at 37°C (C); Dissolution profiles of raw IGUR, NanoIGUR, and NanoIGUR-loaded hydrogel (D). Data represent three independent experiments (mean ± SD), ****p < 0.0001.
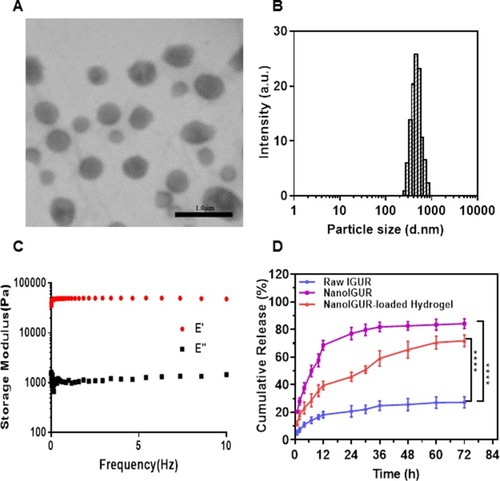
Figure 4 Effects of IGUR in different dosage forms on the proliferation, migration, and invasion of fibroblast-like synoviocytes (RA-FLS). Cell proliferation assay (A); cell migration assay (B); cell invasion assay (C); representative pictures for cell migration assay (D). Representative pictures for cell invasion assay (E). In the in vitro study, 10% FBS high glucose DMEM complete medium (complete medium) was used as the blank control, complete medium containing PBS was used as the sham control for the raw IGUR and the blank gel was used as the sham control for the NanoIGUR-loaded hydrogel. Data represent three independent experiments. **p < 0.01, ***p < 0.001, Scale bar = 100 μm.
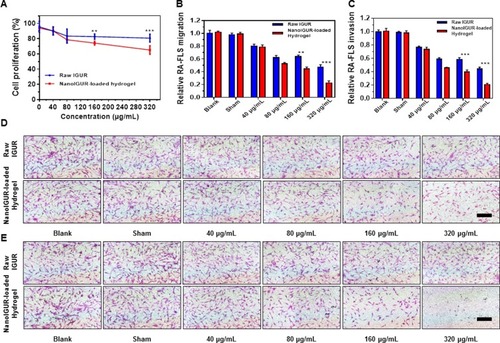
Figure 5 Changes in body weight, ankle joint diameter, and AI scores after drug intervention in CIA models. Comparision of drug concentration–time curve in healthy rats of raw IGUR and NanoIGUR-loaded hydrogel (A); changes in the arthritis index of rats during drug intervention (B); changes in the joint diameter in rats during drug intervention (C); changes in the weight of rats during drug intervention (D); (E) ❶: Induction of collagen-induced arthritis (CIA) model by intradermal infection of bovine type II collagen emulsion; ❷: Swollen joints of CIA model rats; ❸: Ankle joints in healthy rats; ❹: CIA model without any drug intervention showing obvious joint deformity 21 days after the onset; ❺: CIA model rat treated with raw IGUR for 21 days; ❻: CIA model rat treated with NanoIGUR-loaded hydrogel for 21 days. Data represent three independent experiments (mean ± SD), n = 7 per group. *p < 0.05, compared with NanoIGUR-loaded hydrogel, # p < 0.05, compared with raw IGUR.
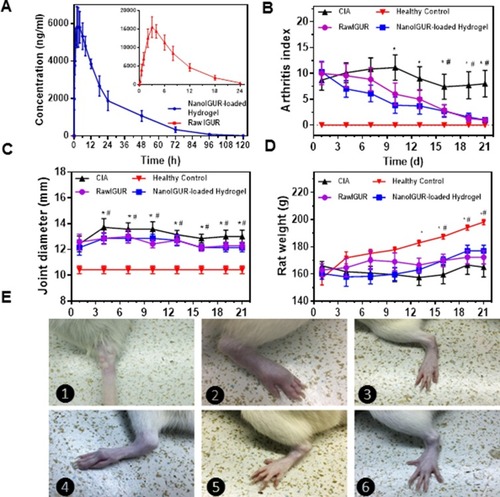
Figure 6 Results of histological evaluation. H&E staining (A); saffron O-fixing green staining (B); Mankin’s score of CIA rats (C); synovitis score of the CIA rats (D); percentage of cartilage area in each group (E); healthy control = healthy normal rats, CIA model = CIA rats with no intervention, raw IGUR= CIA rats treated with raw IGUR 10 mg/kg intragastrically, daily, NanoIGUR-loaded hydrogel= CIA rats treated with NanoIGUR-loaded hydrogel 10 mg/kg by subcutaneous injection, every 3 days. Data represent three independent experiments (mean ± SD), *p < 0.05, **p < 0.01, ***p < 0.001; ns, not significant; n = 7 per group, Scale bar = 200 μm.
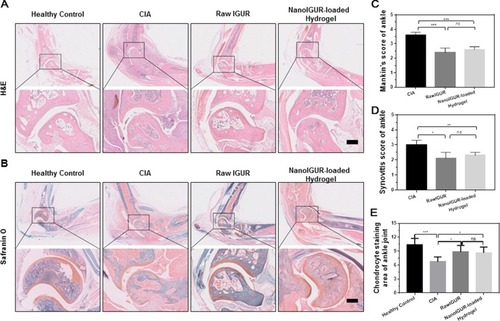
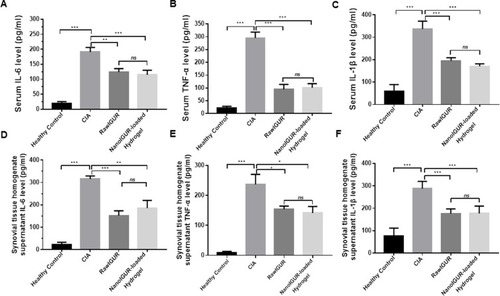
Figure 7 Analysis of the expression of inflammatory cytokines in serum and synovial homogenate supernatants by enzyme-linked immunosorbent assay (ELISA). Serum levels of IL-6 (A), TNF-α (B), and IL-1β (C). Levels of IL-6 (D), TNF-α (E), and IL-1β (F) in the synovial tissue homogenate supernatant. Data represent three independent experiments (mean ± SD), *p < 0.05, **p < 0.01, ***p < 0.001, ns, not significant. n = 7 per group.