Figures & data

Table 1 Saturation Solubility Of HupA In Different Oils, Surfactants And Co-Surfactants
Table 2 Factor Level And Response Data For Full-Factorial Study
Figure 1 RhB-HupA encapsulated in NE was intranasally administrated to rats.
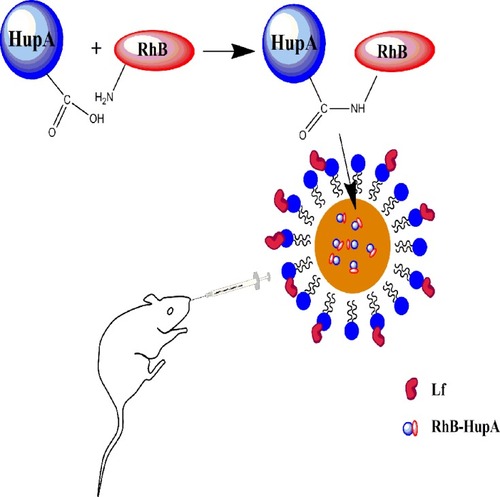
Figure 2 Pseudo-ternary phase diagrams for NE optimization. (A) Smix 1:2, (B) Smix 1:1, and (C) Smix 2:1.
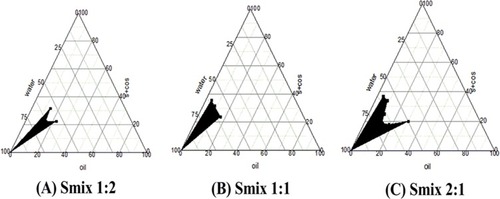
Figure 3 Response surface plots showing significant interaction effects. Globule size (A–C) and PDI (D–F) as the effect of formulation variables.
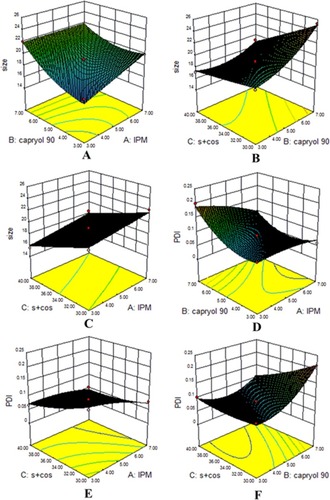
Figure 4 IR spectra for (A) HupA, (B) RhB, and (C) RhB-HupA.
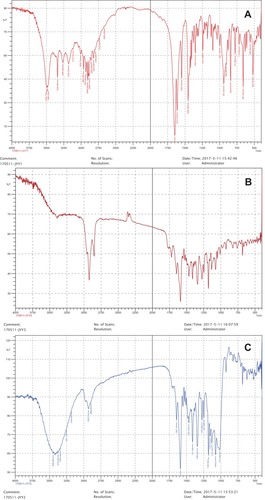
Figure 5 Characterization parameters of optimized NEs (A–C) Droplet size distribution of NE, HupA-NE and Lf- HupA-NE, (D–F) zeta potential of NE, HupA-NE and Lf- HupA-NE.
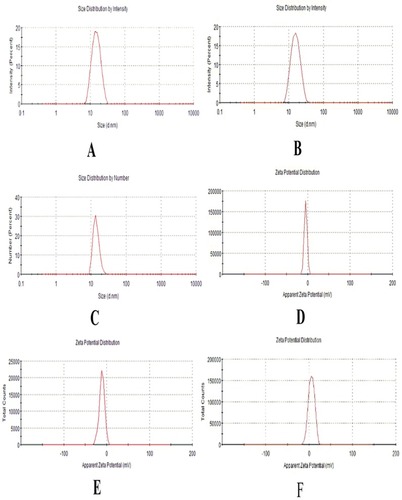
Figure 6 TEM of (A) HupA-NE and (B) Lf-HupA-NE.
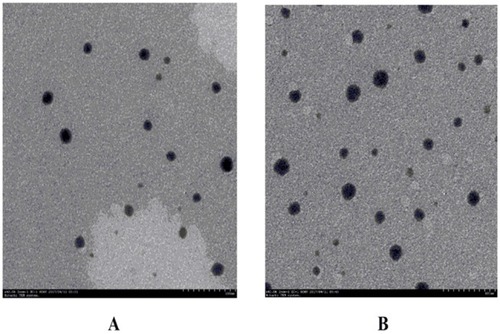
Figure 7 In vitro release results for the HupA suspension, HupA-NE, and HupA-Lf-NE.
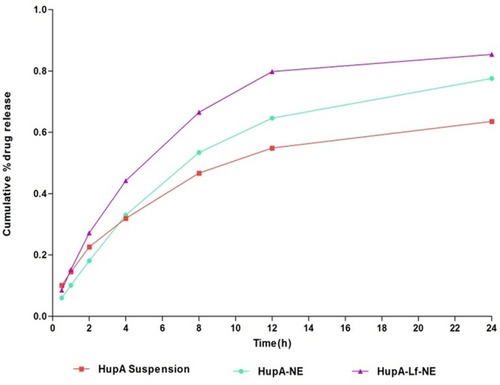
Figure 8 Protein levels of transporters in confluent hCMEC/D3 cells. Lane 1, PBS; Lane 2, HupA-NE; Lane 3, Lf-HupA-NE; and Lane 4, HupA solution.
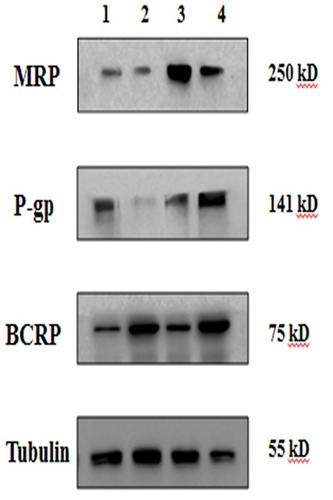
Figure 9 Effects of (A) transporter inhibitors and (B) endocytosis inhibitors on cellular uptake of HupA-NE and Lf-HupA-NE. Values represent the mean±SD (n=3). Statistically significant in comparison with normal control **p<0.01, ***p<0.001.
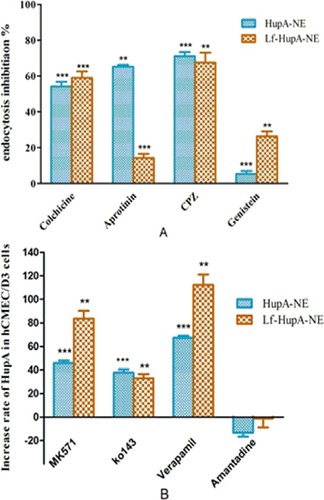
Figure 10 Nasal mucosa of rats treated with (A) normal saline (B) 1% deoxycholic acid sodium solution (C, E, G) HupA-NE on days 1, 7, 14 (D, F, H) Lf-HupA-NE on days 1, 7.14.
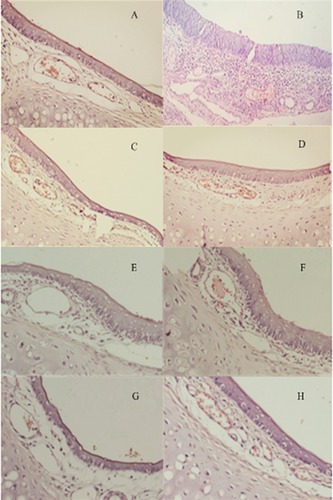
Figure 11 Fluorescence in the brain (A–C) No treatment, (D–F) free RhB-HupA, (G–I) RhB-HupA-NE and (J–L) Lf-RhB-HupA-NE. Red: RhB- HupA, Blue: cell nucleus.
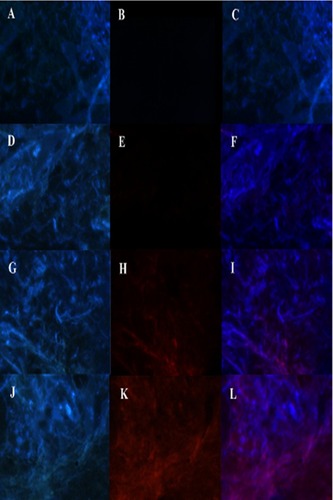
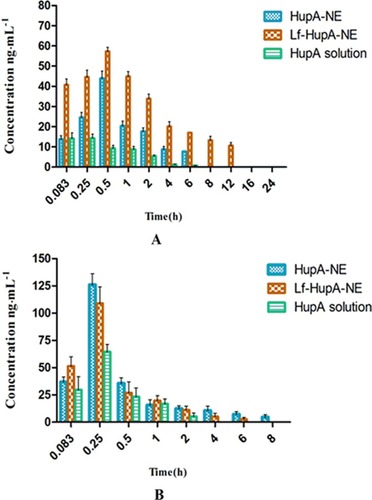
Table 3 Pharmacokinetic Parameters Of HupA-NE, Lf- HupA-NE And HupA Solution In The Brain
Table 4 Pharmacokinetic Parameters Of HupA-NE, Lf- HupA-NE And HupA Solution In The Plasma
Figure 12 Concentration-time graph of HupA in the (A) brain and (B) plasma after intranasal administration of HupA-NE, Lf-HupA-NE, or HupA solution. Values represent the mean±SD (n=6), p<0.05.