Figures & data
Figure 1 Preparation of IL-12 loaded nanoparticles (IL-12-PNP). IL-12-PNP was prepared by the double emulsion method. In brief, the initial W1/O (water/oil) emulsion was prepared by dispersing the inner phase (IL-12 solution) via sonication into the disperse phase with ethyl acetate solution dissolved in PLGA polymer. The W1/O emulsion was injected into PVA solution to form the W1/O/W2 emulsion which was then mechanically stirred to evaporate the organic solvent, washed, and freeze-dried to yield the final nanoparticles.
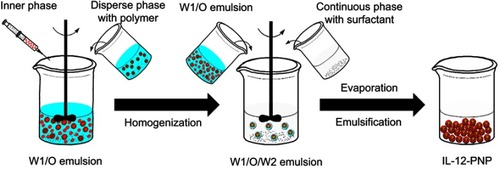
Figure 2 Nanoparticle characterization. (A) Morphology of the nanoparticles was observed under a transmission electron microscope. Bar =200 nm. (B) Nanoparticle size, zeta potential, polydispersity index (PDI), drug loading, and encapsulation efficiency (EE). Data are mean ± SD (n=3). (C) Drug release profile of IL-12-PNP in PBS or PBS with 10% (w/v) rat serum. Groups were compared with non-paired Student’s t-tests. *P<0.05. Data are mean ± SD (n=3).
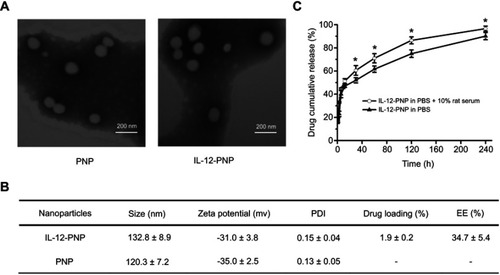
Figure 3 Measurement of cytokines VEGF-A and MMP-9 in rat endothelial cells after in vitro treatment. Cells were treated with IL-12 or IL-12-PNP at an equivalent concentration of 5 ng mL−1 IL-12 for 24 h. Saline-treated cells were negative controls. Fresh medium was added to the cells and they were incubated at 37°C. After various time intervals, the cytokines in the supernatant were analyzed by ELISA (A and B). One-way ANOVA and Newman-Keuls post-hoc test were used to determine differences among ≥3 groups. *P<0.05; **P<0.05. Data are mean ± SD (n=3). On day 7, cellular protein was extracted for Western blot analysis (C). Representative Western blot from three independent experiments.
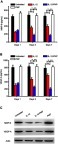
Figure 4 Measurement of cytokines in rat retina after intravitreal IL-12 or IL-12-PNP injections. After various time periods, cytokines were analyzed by ELISA (A and B). One-way ANOVA and Newman-Keuls post-hoc test were used to determine differences among ≥3 groups. *P<0.05; **P<0.05 . Data are mean ± SD (n=3). On day 7, retinal tissue protein was extracted for Western blot analysis (C). Representative Western blot from three independent experiments.
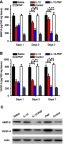
Figure 5 Analysis of VEGF-A expression in rat retina 7 d after intravitreal IL-12 or IL-12-PNP injections. Immunohistochemical assays were performed on tissue sections stained with rabbit anti-rat VEGF-A antibody and hematoxylin-eosin (H&E). Bar =100 μm.
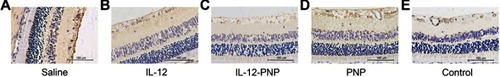
Figure 6 Analysis of MMP-9 expression in rat retina 7 d after intravitreal IL-12 or IL-12-PNP injections. Immunohistochemical assays were performed on tissue sections stained with rabbit anti-rat MMP-9 antibody and hematoxylin-eosin (H&E). Bar =100 μm.
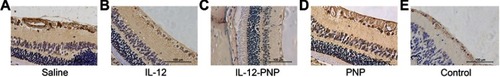
Figure 7 Retinal histology on day 7 after intravitreal IL-12 or IL-12-PNP injections. Each group consisted of six mice. (A) Representative photomicrographs of rat retina stained with H&E. Retinal layers are indicated on the left part of the figure as follows: GCL, ganglion cell layer; IPL, inner plexiform layer; INL, inner nuclear layer; ORL, outer retinal layer. Bar =400 μm. (B) Thicknesses of the total retina. One-way ANOVA and Newman-Keuls post-hoc test were used to determine differences among ≥3 groups. *P<0.05; **P<0.05. Data are mean ± SD (n=12).
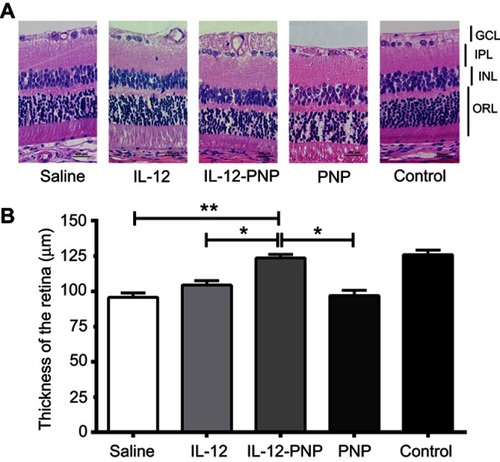
Figure 8 Quantitative analysis of retinal neovascularization by counting vascular lumens on day 7 after intravitreal IL-12 or IL-12-PNP injections. Each group consisted of six mice. (A) H&E-stained sections. Vascular lumens of new vessels growing into the vitreous humor are indicated by black arrows. Bar =50 μm. (B) Data in each column are mean ± SD (n=12). One-way ANOVA and Newman-Keuls post-hoc test were used to determine differences among ≥3 groups. *P<0.05; **P<0.05.
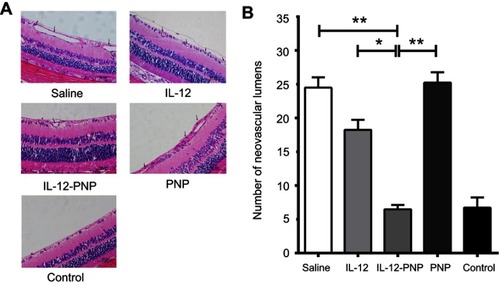
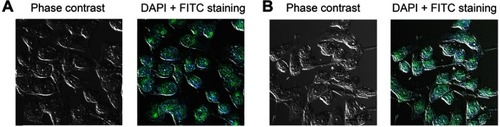
Figure S1 The expression of vWf and CD31 on endothelial cells was confirmed by the immunofluorescence assay. The cells were treated with the first antibodies (anti-rat vWf and anti-rat CD31 antibodies), and treated with FTIC-labeled anti-rabbit secondary antibodies. 4’,6-diamidino-2-phenylindole (DAPI) was used to stain the nuclei. (A) vWf staining. (B) CD31 staining. Bars represent 10 μm