
Figures & data
Figure 1 XRD patterns of (A) core-shell nanoparticles coated with Mg/Al-LDH, (B) core-shell nanoparticles coated with Zn/Al-LDH, (C) pure FNPs, (D) Mg/Al-LDH, (E) Zn/Al-LDH, (F) PEG, (G) 5-FU. The nanoparticles are composed of pure FNPs, PEG, 5-FU and Mg/Al-LDH (for A) or Zn/Al-LDH (for B).
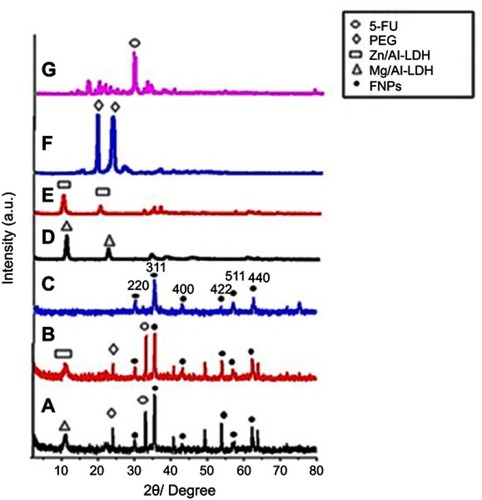
Figure 2 Field emission scanning electron micrograph (FESEM) of (A) FNPs, (B) the nanoparticles co-coated with Mg/Al-LDH, (C) the nanoparticles co-coated with Zn/Al-LDH and EDX spectra of (D) the nanoparticles co-coated with Mg/Al-LDH, (E) the nanoparticles co-coated with Zn/Al-LDH. *The sample holder is made of aluminum, therefore resulting in a high percentage of aluminum, and therefore it is not reliable to indicate the aluminum content of the sample.
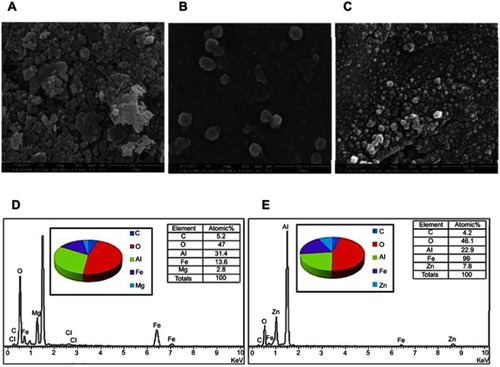
Figure 3 DLS particle size distribution of the nanoparticles co-coated with (A) Mg/Al-LDH, (B) Zn/Al-LDH and their 100% cumulative is given in C and D, respectively.
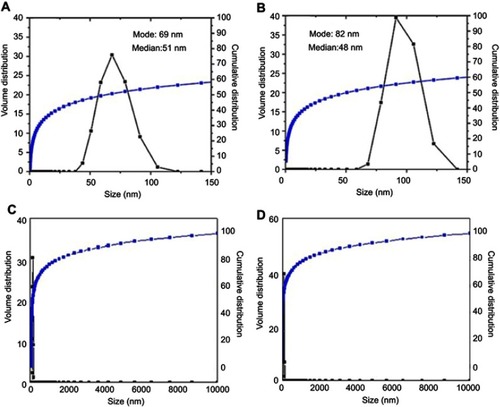
Figure 4 Transmission electron micrographs for (A) the nanoparticles co-coated with Mg/Al-LDH (100 nm bar), (B) Their particle size distribution, (C) the nanoparticles co-coated with Zn/Al-LDH (100 nm bar), (D) their particle size distribution.
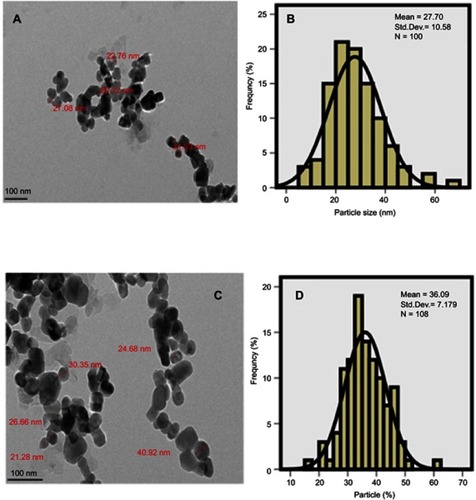
Figure 5 HPLC plot of (A) the nanoparticles co-coated with Mg/Al-LDH, (B) the nanoparticles co-coated with Zn/Al-LDH.
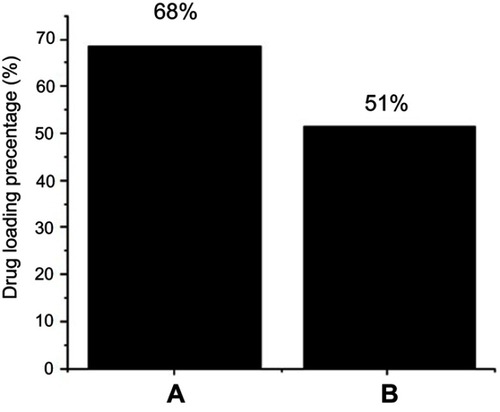
Table 1 Magnetic properties of the nanoparticles
Figure 6 Magnetization curves of (A) FNPs, (B) FPEG-Mg/Al-LDH, (C) FPEG-Zn/Al-LDH, (D) the nanoparticles co-coated with Mg/Al-LDH, (E) the nanoparticles co-coated with Zn/Al-LDH recorded at room temperature.
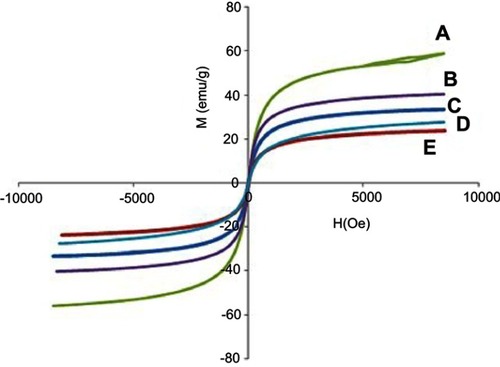
Figure 7 FTIR spectra of pure FNPs, PEG, FPEG, Mg/Al-LDH, Zn/Al-LDH and 5-FU, (A) co-coated with Mg/Al-LDH, (B) co-coated with Zn/Al-LDH.
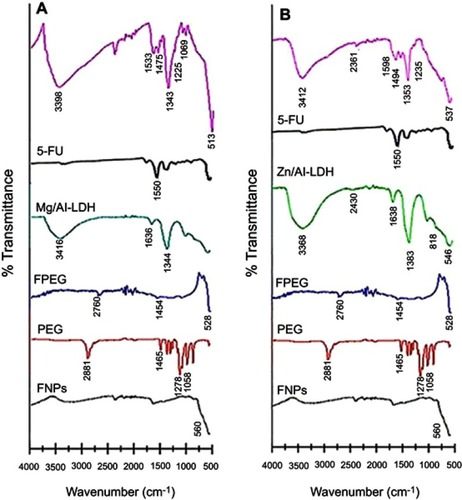
Figure 8 TGA/DTG thermograms of (A) FNPs, (B) pure PEG, (C) 5-FU, (D) Mg/Al-LDH, (E) co-coated nanoparticles with Mg/Al-LDH, (F) Zn/Al-LDH, (G) co-coated nanoparticles with Zn/Al-LDH.
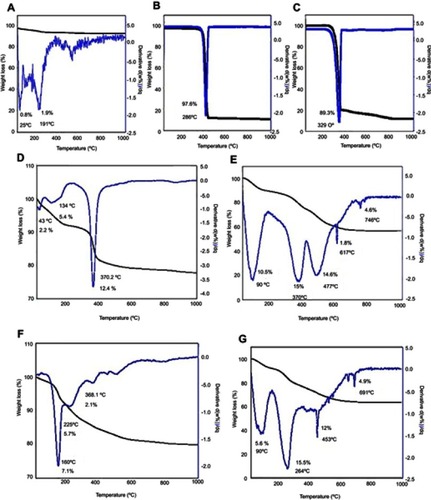
Table 2 Elemental composition of the nanoparticles
Table 3 Percentage of elements in the nanoparticles
Figure 9 Cumulative release profile of 5-fluorouracil from co-coated nanoparticles with Zn/Al-LDH in phosphate-buffer solution at (A) pH 7.4, (B) pH 4.8 and co-coated nanoparticles with Mg/Al-LDH in phosphate-buffer solution at (C) pH 7.4, (D) pH 4.8.
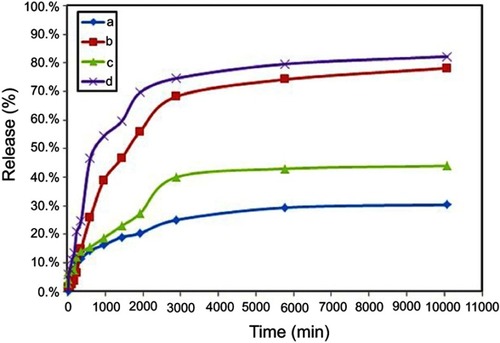
Figure 10 (A) Cytotoxicity assay of iron oxide (Fe), FPEG, FPEG-MLDH, FPEG-ZLDH, 5-Fluorouracil, core-shell nanoparticles, FPVA-FU-MLDH and FPVA-FU-ZLDH against normal 3T3 cells at 72 hrs. (B) Cytotoxicity assay of iron oxide (Fe), FPEG, FPEG-MLDH, FPEG-ZLDH, 5-fluorouracil, core-shell nanoparticles, FPVA-FU-MLDH and FPVA-FU-ZLDH against HepG2 cells at 72 hrs of incubation.
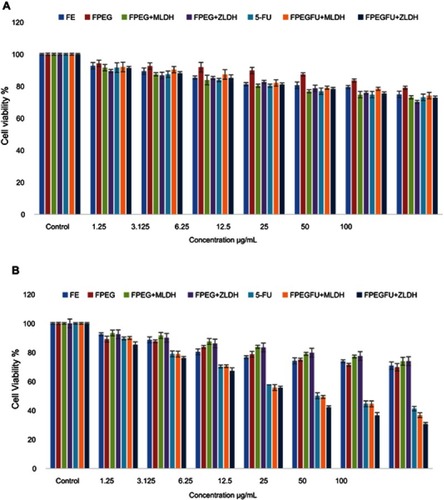
Table 4 The half maximal inhibitory concentration (IC50) value for iron oxide (Fe), FPEG, FPEG-MLDH, FPEG-ZLDH, 5-fluorouracil, core-shell nanoparticles; FPVA-FU-MLDH and FPVA-FU-ZLDH samples tested on 3T3 and HepG2 cell lines