Figures & data
Figure 1 1H NMR spectrum of FPL hybrid peptide (A) the characteristic peak of PEG; (B) the characteristic peak of FA; (C) the characteristic peak of LBMapoB.
Abbreviations: FPL, FA-PEG-LBMapoB; FA, folic acid; LBMapoB, lipid-binding motif of apoB-100.
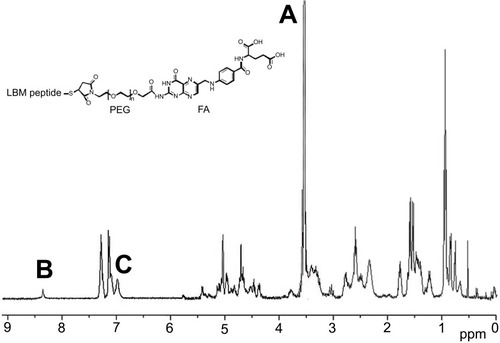
Figure 2 CD spectra of LBMapoB and FPL peptides in trifluoroethanol.
Abbreviations: CD, circular dichroism; FPL, FA-PEG-LBMapoB; LBMapoB, lipid-binding motif of apoB-100.
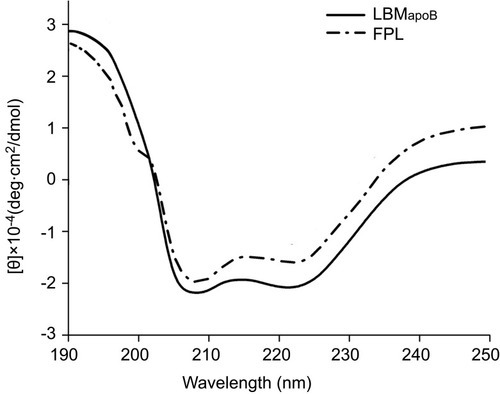
Figure 3 Particle sizes of FPLM NPs with various compositions. (A) The effect of FPL weight ratio on the particle size of FPLM NPs and (B) the effect of PEG length on the particle size of FPLM NPs. All data are shown as means ± SD (n=3).
Abbreviations: FPLM NPs, FPL decorated lipoprotein-mimic nanoparticles; FPL, FA-PEG-LBMapoB; LBMapoB, lipid-binding motif of apoB-100.
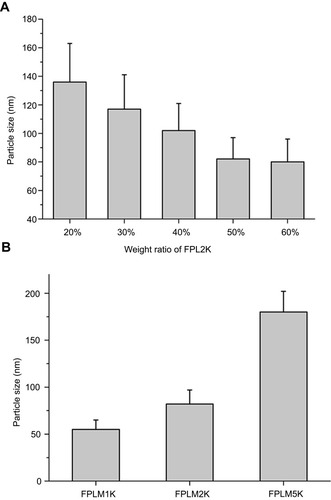
Table 1 Formulation compositions of blank PLM NPs, PTX-loaded PLM NPs, blank FPLM NPs, and PTX-loaded FPLM NPs
Figure 4 Colloidal stabilities of FPLM NPs with various compositions in 4.5% BSA solution. (A) The effect of peptide ratio on the stability of FPLM NPs and (B) the effect of peptide composition on the stability of NPs. All data are shown as means ± SD (n=3).
Abbreviations: LBMapoB, lipid-binding motif of apoB-100; LM NPs, LBMapoB decorated lipoprotein-mimic nanoparticles; FPLM NPs, FPL decorated lipoprotein-mimic nanoparticles; FPL,FA-PEG-LBMapoB.
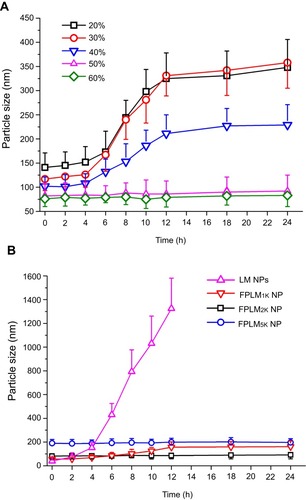
Table 2 The particle sizes and zeta potentials of FPLM NPs in PBS (0.1 M, pH7.4)
Figure 5 TEM image of FPLM NPs.
Abbreviations: TEM, transmission electron microscope; LBMapoB, lipid-binding motif of apoB-100; FPLM NPs, FPL decorated lipoprotein-mimicnanoparticles; FPL, FA-PEG-LBMapoB.
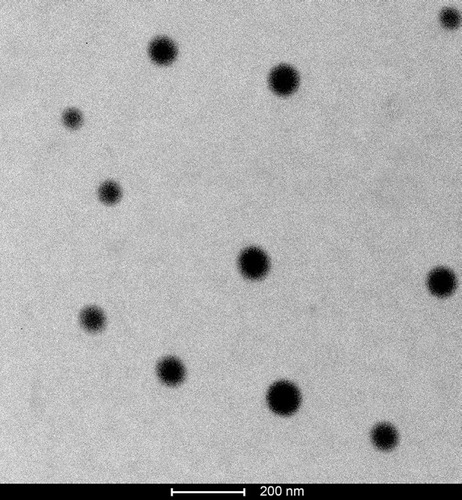
Figure 6 In vitro release profiles of PTX from FPLM NPs and Taxol formulation in pH 7.4 PBS containing 1 M sodium salicylate at 37°C. All data are shown as means ± SD (n=3).
Abbreviations: LBMapoB, lipid-binding motif of apoB-100; FPLM NPs, FPL decorated lipoprotein-mimicnanoparticles; FPL, FA-PEG-LBMapoB.
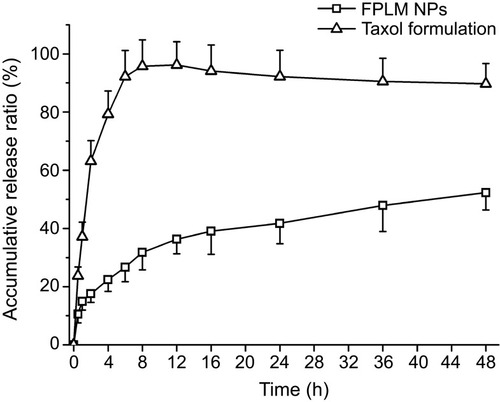
Figure 7 Cellular uptake characteristic of FITC-FPLM NPs. (A) The uptake comparison of FITC-PLM NPs and FITC-FPLM NPs in HeLa cells (FR+) and A549 cells (FR-); (B) Concentration-dependent uptake of FITC-FPLM NPs by HeLa cells. (C) Time-dependent uptake of FITC-FPLM NPs by HeLa cells. All data are shown as means ± SD (n=6).
Abbreviations: LBMapoB, lipid-binding motif of apoB-100; PLM NPs, mPEG-LBMapoB decorated lipoprotein-mimic nanoparticles; FPLM NPs, FPL decorated lipoprotein-mimicnanoparticles; FPL, FA-PEG-LBMapoB.
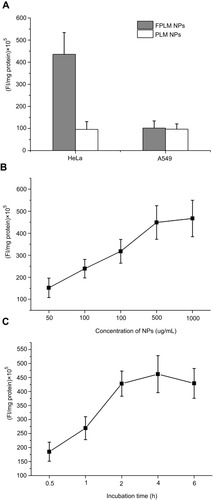
Figure 8 The intracellular distribution of FITC-FPLM NPs in HeLa cells at different coincubation times (0.5 hrs, 1 hr, and 4 hrs).
Abbreviations: FITC, fluorescein isothiocyanate; LBMapoB, lipid-binding motif of apoB-100; FPLM NPs, FPL decorated lipoprotein-mimicnanoparticles; FPL, FA-PEG-LBMapoB.
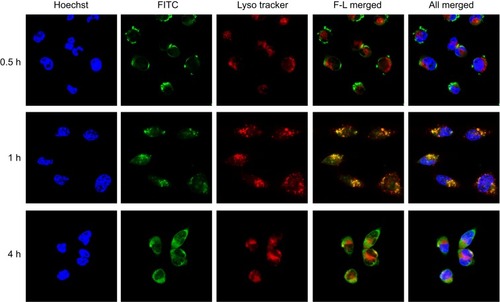
Figure 9 Investigation of the cellular internalization mechanism of FPLM NPs in HeLa cells by using inhibitors of endocytosis. The internalization ratio was normalized to that of the control (FPLM NPs internalization in the absence of inhibitors). All data are shown as means ± SD (n=6).
Abbreviations: CPZ, chlorpromazine hydrochloride; LBMapoB, lipid-binding motif of apoB-100; FPLM NPs, FPL decorated lipoprotein-mimicnanoparticles; FPL, FA-PEG-LBMapoB.
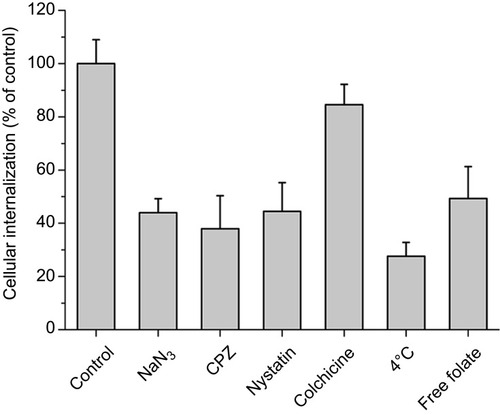
Figure 10 In vitro cytotoxic effect of PTX-loaded PLM NPs, PTX-loaded FPLM NPs, and Taxol formulation against (A) HeLa and (B) A549 cells after incubation for 24 hrs at various concentrations of PTX. The viability of HeLa cells, A549 cells, and CHL cells treated with (C) blank PLM NPs and (D) blank FPLM NPs for 24 hrs at different concentrations of NPs. All data are shown as means ± SD (n=6).
Abbreviations: LBMapoB, lipid-binding motif of apoB-100; PLM NPs, mPEG-LBMapoB decorated lipoprotein-mimic nanoparticles; FPLM NPs, FPL decorated lipoprotein-mimicnanoparticles; FPL, FA-PEG-LBMapoB.
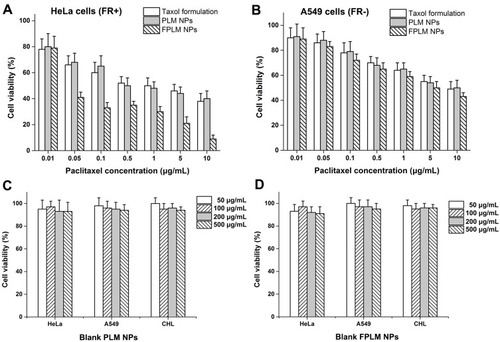
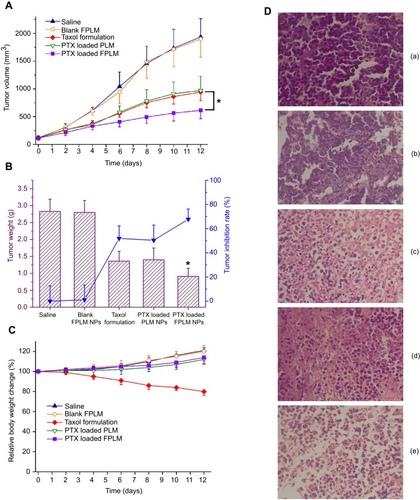
Figure 11 In vivo therapeutic efficacy of the different PTX formulations at a dose of 5 mg/kg in M109 lung tumor-bearing mice. (A) Changes of tumor volumes in mice during the experimental period; (B) The dissected tumor weights and the tumor inhibition rates on day 12; (C) Relative body weight changes of tumor-bearing mice during the treatment. Error bars represent SDs (n=5). (D) Images of tumor sections separated from mice stained by H&E on day 12 (a: saline; b: blank FPLM; c: Taxol formulation; d: PTX-loaded PLM; e: PTX-loaded FPLM).
Notes: *p<0.05, compared with Taxol formulation group.
Abbreviations: LBMapoB, lipid-binding motif of apoB-100; FPLM NPs, FPL decorated lipoprotein-mimicnanoparticles; FPL, FA-PEG-LBMapoB.