Figures & data
Table 1 Formulations of blank-SLNs
Table 2 Formulations of TCR-SLNs
Table 3 Grading scale for the Draize test
Figure 1 DSC thermograms of: (A) the raw surfactant and blank SLNs prepared with surfactant; (B) the raw materials and prepared TCR-SLNs.
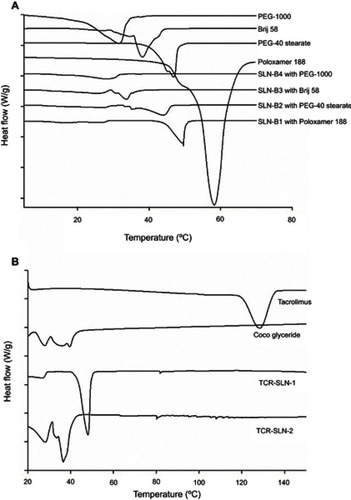
Table 4 Particle properties of TCR-SLNs (mean ± standard deviation)
Figure 2 XRD patterns of the raw materials and prepared TCR-SLNs.
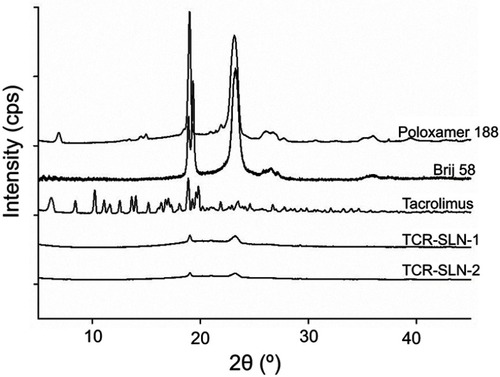
Figure 3 FT-IR spectra of the raw materials, prepared TCR-SLNs, and physical mixtures of TCR-SLN materials.
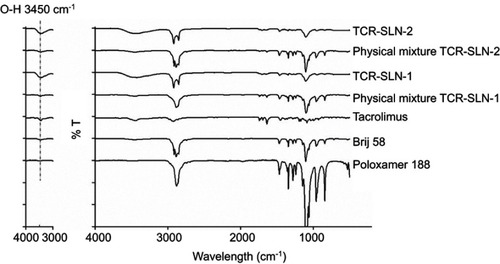
Figure 4 TEM images of TCR-SLNs dried at different temperatures (magnification: ×12,500, scale bar =500 nm).
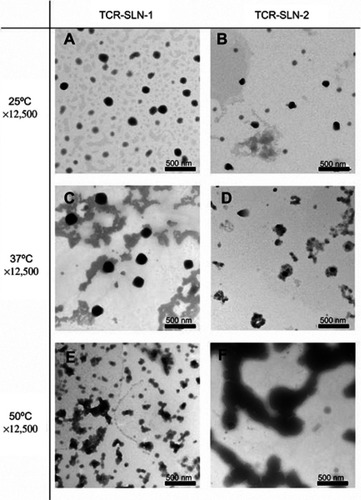
Table 5 Amount of TCR accumulated in 24 h in the in vitro and ex vivo test conducted at 37 °C on TCR-SLNs stored at different temperatures for 2 h (mean ± standard error; *Student’s t-test, p-value <0.05 with TCR-SLN-2; **Student’s t-test, p-value <0.005 with TCR-SLN-2)
Figure 5 FT-IR imaging of the stratum corneum and skin at different depths after ex vivo skin penetration test at 37 °C using the reference product and TCR-SLNs.
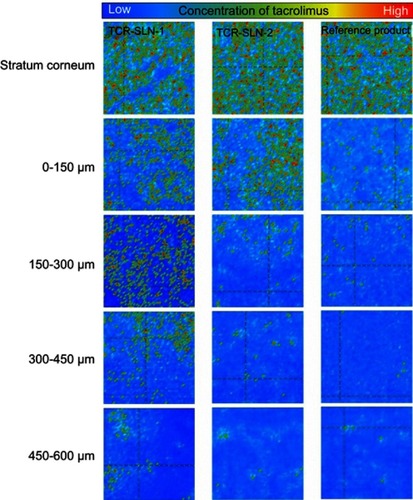
Figure 6 In vivo skin penetration test using reference product and TCR-SLN-1 (mean ± standard error; S.C.: stratum corneum, *Student’s t-test, p-value <0.05 compared with the reference product; **Student’s t-test, p-value <0.01 compared with the reference product).
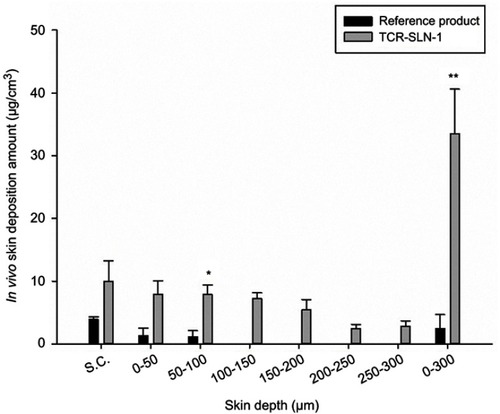
Figure 7 FT-IR imaging of the stratum corneum and skin at different depths after in vivo skin penetration test using the reference product and TCR-SLN-1.
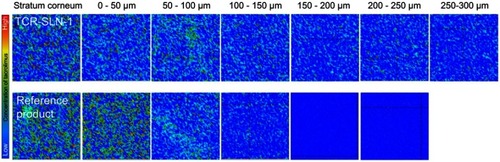
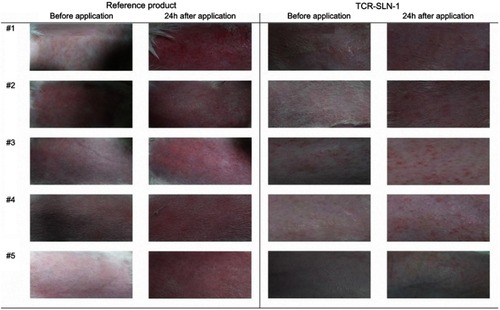
Table 6 Skin irritation test of the reference product and TCR-SLN-1 (mean ± standard error; **Student’s t-test, p-value <0.005 compared with the reference product)
Figure S1 Images of skin samples from each group (24h after drug application)