Figures & data
Figure 1 Data of factorial design as hydrothermal time, temperature, ultrasound irradiation power and interaction between these factors by the size (nm).
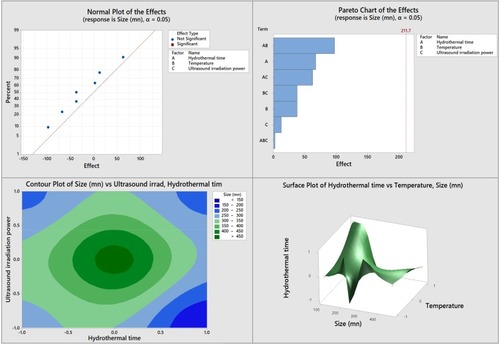
Figure 2 XRD patterns of the α-Al2O3 NPs and the as-synthesized La3+/α-Al2O3 NPs heating after calcination at 300°C for 3 hours.
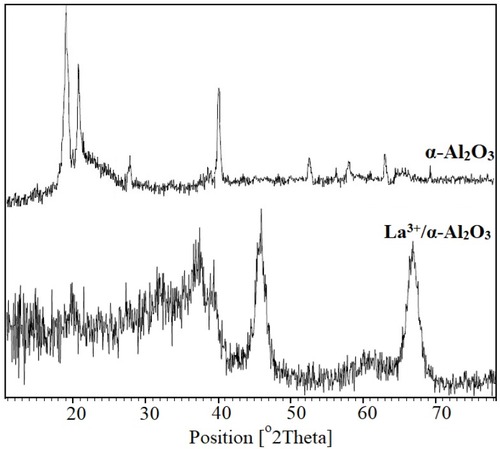
Figure 3 The SEM image (A), TEM image (B) and electron dispersive spectroscopy (EDX) (C) as- synthesized La3+/α-Al2O3 NPs prepared via ultrasound assisted hydrothermal method.
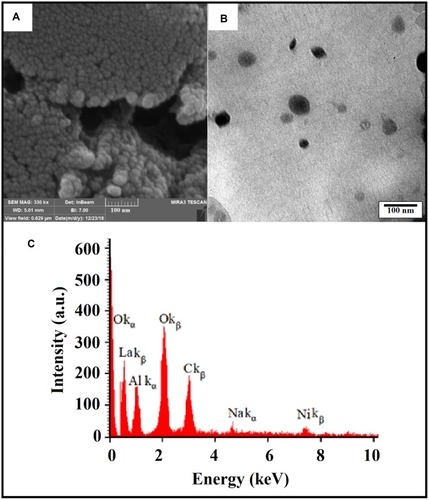
Figure 4 Elemental mapping analysis of the as-synthesized La3+/α-Al2O3 NPs (A) and the UV-vis spectra of the as synthesized La3+/α-Al2O3 NPs in different conditions such as 10 hours (S1), 8 hours (S2), 6 hours (S3), and 4 hours (S4) at 200°C (B).
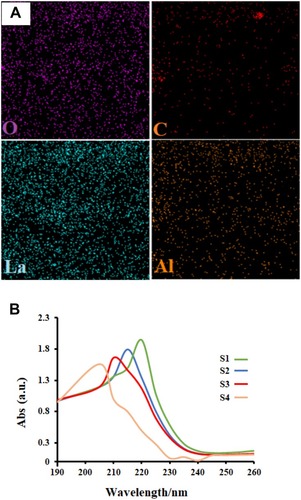
Figure 5 The FT-IR spectrum of the α-Al2O3 (A), La3+/α-Al2O3 nanocomposites as-synthesized after 300°C (B) and AFM images of the La3+/α-Al2O3 nanocomposites after annealing at 200°C for 6 hours (C).
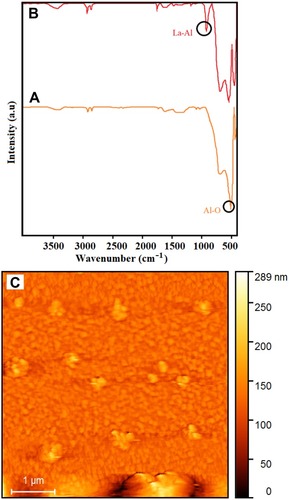
Figure 6 The N2 adsorption/desorption isotherm (A) and pore size distribution curve data of the La3+/α-Al2O3 nanocomposites (B).
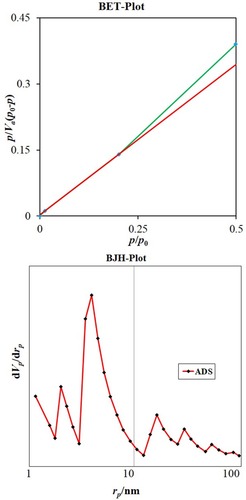
Table 1 The Surface Features of the La3+/α-Al2O3 Nanocomposites as-synthesized after 300°C
Table 2 Antibacterial Activity of the La3+/α-Al2O3 Nanocomposites with MIC (μg/Ml) Method Against Selected Gram-Positive and Gramnegative Pathogenic Bacterial Strains
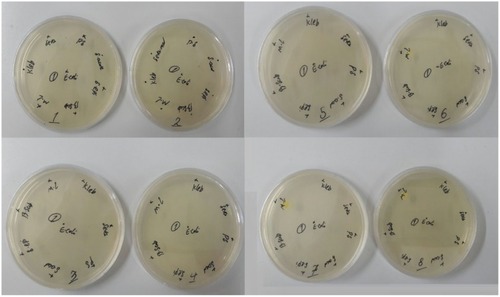
Figure 7 Antibacterial activity of La3+/α-Al2O3 nanocomposites against 4 gram-negative and 3 gram-positive bacteria. Different serial dilutions were 64 (plate1), 32 (plate 2), 16 (plate 3), 8 (plate 4), 4 (plate 5), 2 (plate 6), 1 (plate 7) and 0.5 (plate 8) μg/mL of the La3+/α-Al2O3 nanocomposites which added to the Mueller-Hinton agar medium.
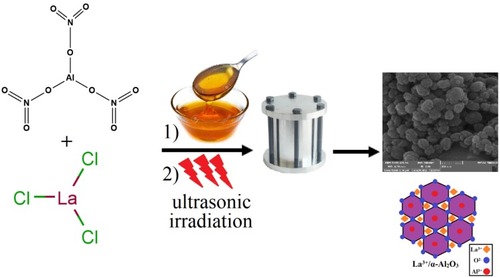
Scheme 1 Summary of experimental route for the synthesis of the La3+/α-Al2O3 NPs.