Figures & data
Figure 1 Synthesis and characterization of MFTC. (A) A 16-carbon fatty acid modified MFTC was synthesized with a final yield of 90%. (B) FTIR spectrum of MFTC showing, highlighted in dashed circles, absorption peaks at 2920 and 2860 cm−1 that correspond to CH2-CH2 stretches of the fatty acid chain and at 1745 cm−1 that corresponds to the carbonyl functional group that is part of the formed ester bond. (C) XRD analysis of FTC and MFTC demonstrates the crystalline nature of both drugs. (D) Aqueous solubility of FTC and MFTC demonstrates decrease in solubility of MFTC (mean±SD, n=3; ***P≤0.001). (E) EC50 (dashed line) was determined in vitro by HIV-1 RT activity assay (0.079 and 0.033 µM for FTC and MFTC, respectively) demonstrating the chemical modification did not significantly change the antiretroviral activity of FTC. Results were analyzed by nonlinear regression fit (mean±SD, n=3).
Abbreviations: FTC, emtricitabine; MFTC, modified FTC prodrug; FTIR, Fourier transform infrared spectroscopy; XRD, X-ray diffraction; RT, reverse transcriptase; EC50, half maximum effective concentration.
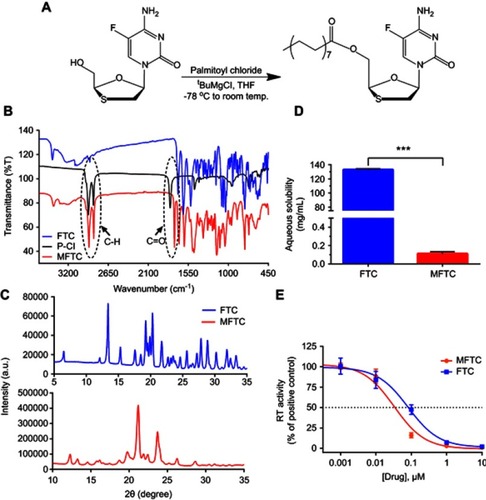
Figure 2 Nanoformulation characteristics. NMFTC was synthesized by high-pressure homogenization using P407 as excipient. NMFTC stability was assessed for up to 10 weeks at (A) 25°C, and (B) 4°C in terms of particle size, PDI, and zeta potential (mean±SD, n=3). (C) The size and morphology of NMFTC was assessed by TEM.
Abbreviations: NMFTC, nanoparticle of modified FTC prodrug; PDI, polydispersity index; TEM, transmission electron microscopy.
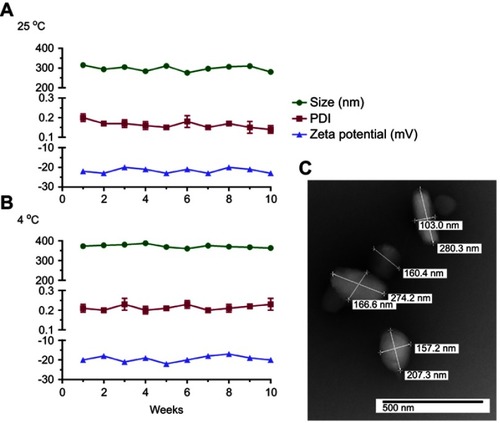
Figure 3 NMFTC in vitro characteristics. (A) Cytotoxicity was assessed in MDMs by MTT assay after 4 days of treatment with FTC or MFTC or NMFTC over a range of concentrations (10–400 µM). Results were normalized to untreated control cells. (B) Drug uptake in MDMs was measured over 24 hrs showing higher NMFTC uptake compared to FTC reaching high peak after 4 hrs. Intracellular FTC-TP concentrations demonstrate higher (C) uptake of NMFTC over 8-hr period, and longer (D) retention after 8-hr exposure for up to 10 days as compared to FTC. (E) TEM showing an MDM loaded with NMFTC (white clusters) after 4-hr exposure. Results in (A), (B), (C) and (D) are shown as mean±SD, n=3; *P≤0.05, **P≤0.01, ***P≤0.001.
Abbreviations: MDM, monocyte-derived macrophage; FTC, emtricitabine; NMFTC, nanoparticle of modified FTC prodrug; TEM, transmission electron microscopy; CCK-8: cell counting kit-8.
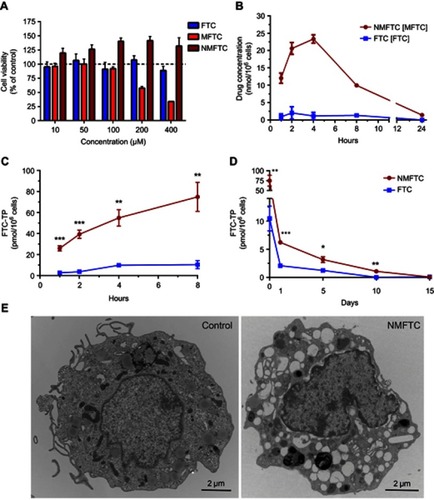
Figure 4 NMFTC antiretroviral activity. (A) HIV-1 RT activity in FTC and NMFTC pre-exposed MDMs showing complete inhibition with NMFTC for up to 10 days as compared with FTC that did not have effect beyond day 1 (mean±SD, n=9; ***P≤0.001). (B) HIV-1 p24 antigen staining showing results similar to RT assay demonstrated by the absence of p24 staining (brown color) for up to 10 days after NMFTC pre-exposure whereas FTC had no effect by day 1.
Abbreviations: RT, reverse transcriptase; FTC, emtricitabine; NMFTC, nanoparticle of modified FTC prodrug; MDM, monocyte-derived macrophage.
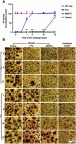
Figure 5 MFTC enzymatic cleavage kinetics in plasmas of six different species demonstrate species difference in (A) prodrug hydrolysis; rate of hydrolysis: mouse, rat>rabbit>monkey>dog and human. (B) The hydrolyzed prodrug reverted back to the parent drug as indicated by increased formation of FTC.
Abbreviations: FTC, emtricitabine; MFTC, modified FTC prodrug.
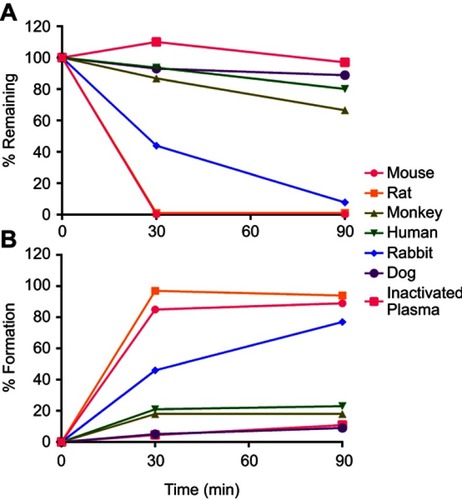
Figure 6 NMFTC pharmacokinetics. Sprague-Dawley rats were injected IM with 45, 75 or 100 mg/kg FTC or FTC-equivalent dose of NMFTC. NMFTC resulted in significantly higher FTC concentrations, as compared to FTC, in rat (A) plasma, (B) liver, (C) spleen, (D) LNs and (E) brain. Results are shown as mean±SEM, n=3–5; *P≤0.05, **P≤0.01, ***P≤0.001.
Abbreviations: FTC, emtricitabine; NMFTC, nanoparticle of modified FTC prodrug; LN, lymph node; SEM, standard error of the mean.
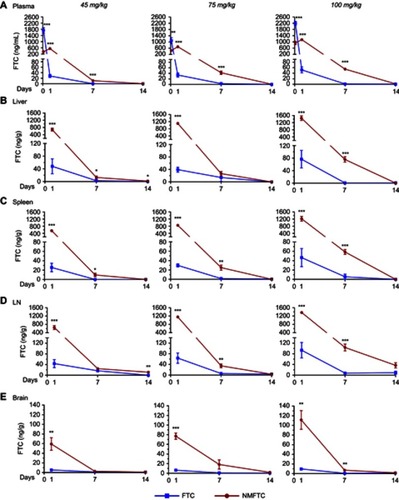
Figure 7 Intracellular FTC-TP. Sprague-Dawley rats were injected IM with 45, 75 or 100 mg/kg FTC or FTC-equivalent dose of NMFTC. NMFTC resulted in significantly higher intracellular FTC-TP concentrations, as compared to FTC, in rat (A) PBMCs, (B) spleen and (C) LNs. Results are shown as mean±SEM, n=3–5; *P≤0.05, **P≤0.01, ***P≤0.001.
Abbreviations: FTC, emtricitabine; FTC-TP, FTC triphosphate; NMFTC, nanoparticle of modified FTC prodrug; PBMC, peripheral blood mononuclear cell; LN, lymph node; SEM, standard error of the mean.
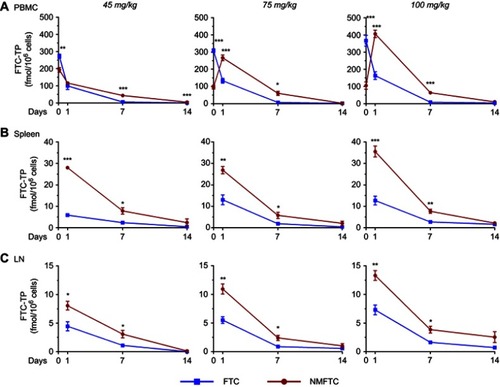
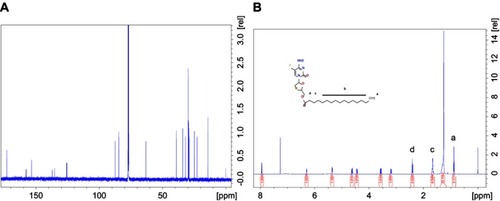
Figure S1 (A) 1H and (B) 13C- NMR spectra of MFTC in CDCl3. Additional peaks corresponding to the protons and carbon atoms of the fatty acid chain confirmed derivatization of FTC.
Abbreviations: 1H-NMR, proton nuclear magnetic resonance; 13C-NMR, carbon nuclear magnetic resonance; MFTC, modifies FTC prodrug.