Figures & data
Figure 1 Antiangiogenic gold nanoparticles block the chronic myeloid leukemia (K562) derived exosomes induced angiogenesis.
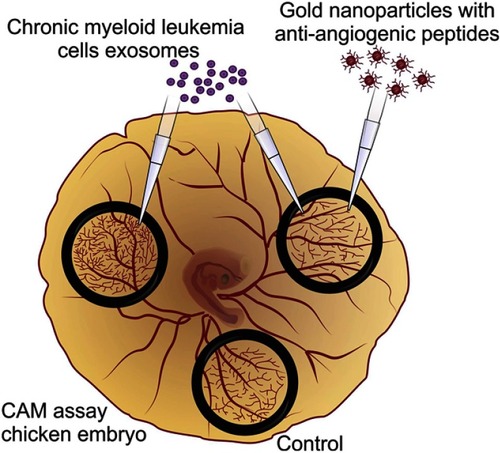
Figure 2 Image of the chicken embryo aspect (A) and of the interior of each O-ring placed on the chorioallantoic membrane (CAM). Images were acquired after 24 hrs incubation with 0 µg/mL (B), 5 µg/mL (C) or, 50 µg/mL (D) of K562 derived exosomes. Whiskers plots of the percentage of newly formed vessels after exposure to 5 µg/mL (gray bars) or 50 µg/mL (black and white bars) of K562 exosomes (E). Bars represent the maximum, minimal, and mean of at least seven independent experiments, represented as dots (5 µg/mL) and squares (50 µg/mL), normalized to the number of tertiary veins obtained after exposure to phosphate buffer saline (PBS) and to the normalized number obtained in the corresponding CAM area at 0 hrs incubation in the same embryo. Dotted line at 100% normalized newly formed vessels refers to the control sample – number of tertiary veins obtained after exposure to PBS and to the normalized number obtained in the corresponding CAM area at 0 hrs incubation. ***p-value 0.0003, **p-value 0.0056, *p-value 0.13 comparing to the CAM regions exposed to PBS. p-value was calculated using an unpaired t-test with Welch’s correction.
Abbreviation: PBS, phosphate buffer saline.
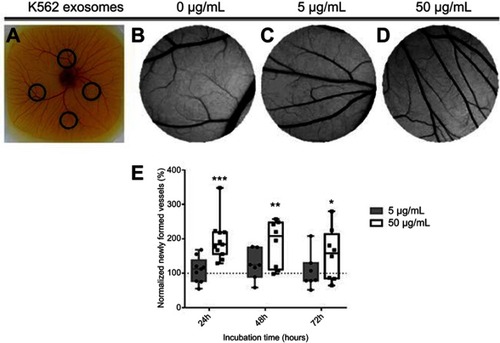
Figure 3 Aspect of the CAM areas treated for 24 hrs with phosphate buffer saline (PBS, control), Exosomes from K562 cells (50 µg/mL), Exosomes from fibroblasts (50 µg/mL), and a mixture of K562 exosomes (50 µg/mL) and 16.4 nM antiangiogenic-AuNPs. (A) Green channel images of the CAM region. (B) Respective segmented image used to calculate the number of branches. (C) Whiskers plots of the percentage of newly formed vessels obtained 24 and 48 hrs after exposure to Exosomes from K562 cells (50 µg/mL) (Exos K562, black bars with white filling); Exosomes from fibroblasts (50 µg/mL) (Exos Fib, gray bars with light gray filling); a mixture of K562 exosomes (50 µg/mL) and 16.4 nM antiangiogenic-AuNPs (Exos K562+ AuNP, black bars with dark gray filling). Bars represent the maximum, minimal, and mean of at least six independent experiments, represented as dots (Exos K562), squares (Exos Fib), or triangles (Exos K562+ AuNP) normalized to the number of tertiary venules obtained in the corresponding CAM area at 0 hrs incubation in the same embryo and to the number of venules obtained after exposure to PBS. Dotted line at 100% normalized newly formed vessels refers to the control sample – number of tertiary venules obtained after exposure to PBS and to the normalized number obtained in the corresponding CAM area at 0 hrs incubation. *1 p-value 0.0113, *2 p-value 0.0212, *3 p-value 0.040 relative to control.
Abbreviations: CAM, chorioallantoic membrane; PBS, phosphate buffer saline.
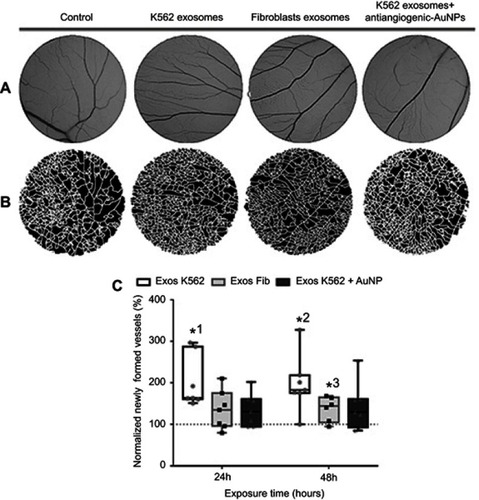
Figure 4 Whiskers plots of IL8, VEGFA , and VEGFR1 mRNA levels after (A) 12 hrs and (B) 24 hrs of CAM exposure to Exosomes from K562 cells (50 µg/mL) (Exos K562, red bars with blue dots), or a mixture of K562 exosomes (50 µg/mL) and 16.4 nM antiangiogenic-AuNPs (Exos K562+ AuNP, black bars with gray squares). Data were normalized relatively to GAPDH mRNA levels and subsequent normalization with CAM treated with PBS. With this procedure, PBS (control) equals to 1 for all analyzed proteins. *p-value 0.014, **p-value 0.004, *1 p-value 0.035, *2 p-value 0.022 relative to the same gene in CAM treated with exosomes alone.
Abbreviations: CAM, chorioallantoic membrane; PBS, phosphate buffer saline.
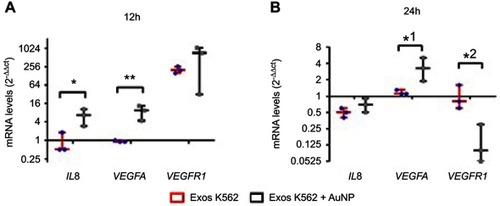
Figure S1 Evaluation of exosome isolation. Supernatant of Fibroblasts and K562 cells was collected, filtered in a 0.2μm filter and concentrated in Centrifugal Filter Devices with 3KW cut-off. An aliquot of the K562 concentrated supernatant was collected and analysed (Concentrated supernatant K562). Total exosome isolation reagent for culture media (ThermoFisher) was added to each concentrated supernatant and exosomes collected according to the manufacturer’s instructions (Exos Fibroblasts and Exos K562). For Western-Blot analysis, 40μg of protein from each sample was separated by SDSPAGE, transferred to a PVDF membrane and stained with Ponceau solution (A). The presence of CD-81 tetraspanin was then analysed with CD-81 antibody (1D6, Novus biologicals Cat# NB100-65805, RRID:AB_962702) (B). The expected weight of CD-81 is 26KDa. Dynamic light scattering of particle distribution in K562 exosome suspension (C)
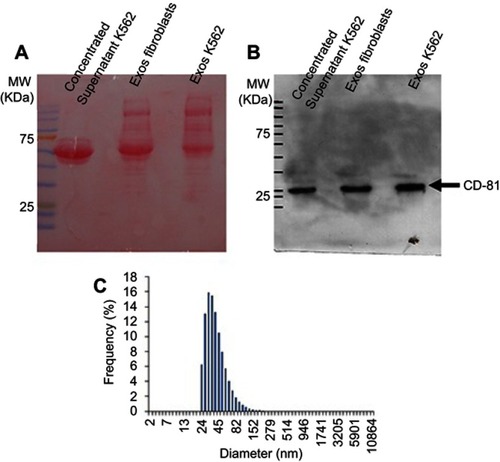
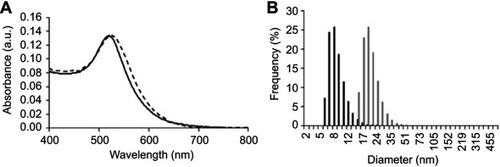
Figure S2 Characterisation of the antiangiogenic-AuNPs. (A) UV–Vis spectra of AuNPs (continuous black line) and antiangiogenic-AuNPs (doted grey line). A red shift of the surface plasmon resonance peak in the UV–Vis spectrum infers successful functionalisation with the peptide. (B) Dynamic light scattering with diameter distribution of AuNPs (black bars), with an average diameter of 17·5±0·4nm, and antiangiogenic-AuNPs (grey bars), with an average diameter of 32·8±0·4nm