Figures & data
Table 1 Construct Test Conditions of Vit D-NPs
Figure 1 Characterization of vit. D-NPs and size distribution by transmission electron microscope (TEM) and differential light scattering (DLS). (A) TEM images show that vit. D–NPs are spherical in shape and sub-200 nm in size. (B) Hydrodynamic diameters of all liposome formulations were measured by DLS.
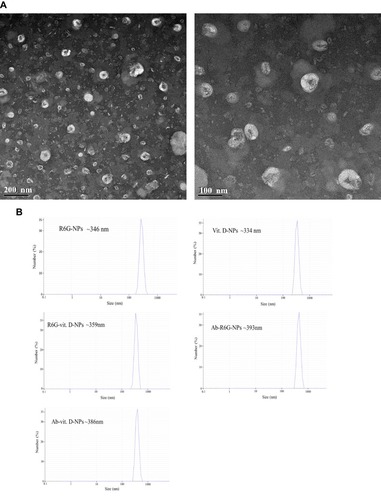
Figure 2 Release profile from vit. D-NPs over 72 hrs. From the release profile, the vit. D-NPs appear to release vitamin D in a slow and sustained manner.
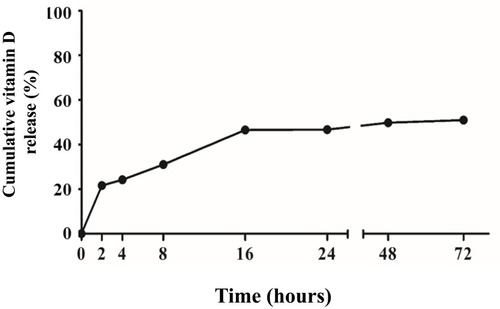
Figure 3 The cell viability assay of primary mesothelial cells treated with different concentrations of vit. D-NPs as analyzed via an XTT assay. Primary human peritoneal mesothelial cells were incubated with PBS, free vitamin D, or vit. D-NPs at different concentrations (L: 0.5, M: 1, H: 2μM). The XTT assay shows that the vitamin D nano-DDS were non-toxic to primary human peritoneal MCs. Data are represented as means ± SD (mean ± SD, n=6; **P<0.01, ***P<0.001, compared with the control group).
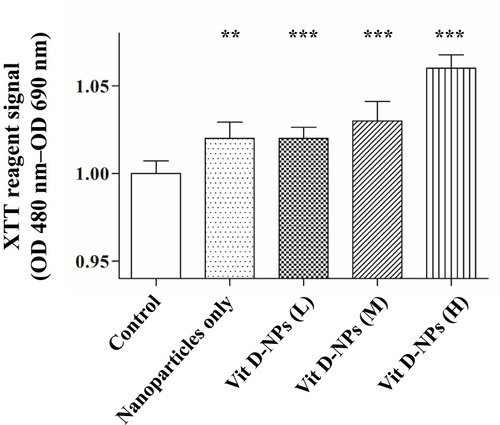
Figure 4 Cellular uptake of R6G-vit D-NPs by mesothelial cells. (A) Cellular uptake study of R6G-vit D-NPs treated with mesothelial cells (HMrSV5). The treated cells were harvested at different time-points and cellular uptake was monitored by fluorescence microscopy (red fluorescence). (B) The percentage of mesothelial cells which uptake R6G-vit. D-NPs (mean ± SD, n=6).
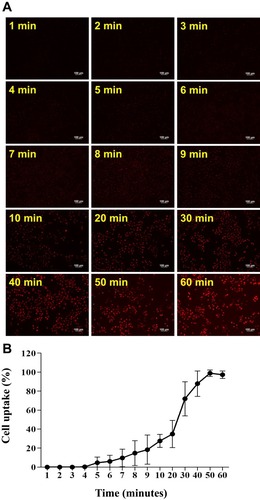
Figure 5 Vitamin D3-encapsulated nanoparticles inhibit the TGF-β1-induced epithelial-to-mesenchymal transition (EMT) of mesothelial cells (MCs) in vitro. (A) The Western blot analysis showed that 1α, 25(OH)2D3 (10−6 mol/L)-encapsulated nanoparticles had the same effect as the inhibited TGF-β1-induced EMT process of MCs. (B) Normalized data of protein levels of E-cadherin and Snail. (mean ± SD, n≥3; **P<0.01, ***P<0.001, compared with the control group; #P<0.05, ##P<0.01, compared with the TGF- β group).
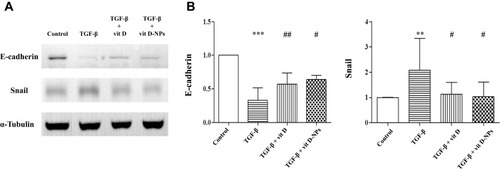
Figure 6 Ab-R6G-NPs displayed enhanced peritoneal targeting. C57BL/6 mice received intraperitoneal (i.p.) injection with nanoparticles conjugated with or without GPM6A antibody (R6G-NPs/Ab-R6G-NPs). Mice received i.p. instillation of PBS as a control group. Parietal peritoneum and mesentery samples were taken 72 hrs after the first i.p. injection. (A) In vivo imaging system (IVIS) show that R6G fluorescence was observed in all mice in the Ab-R6G-NPs group significantly after 72 hrs of injection. (B) Normalized radiant efficiency of R6G fluorescence of panel (A). (C) Parietal peritoneum and mesentery show R6G fluorescence after 72 hrs of injection. (D) Normalized radiant efficiency of R6G fluorescence of panel (C). (Data are represented as mean ± SD, n≥3; **P<0.01, compared with the control group; *P<0.05, **P<0.01, compared with the control group; ##P<0.01, compared with the R6G-NPs group).
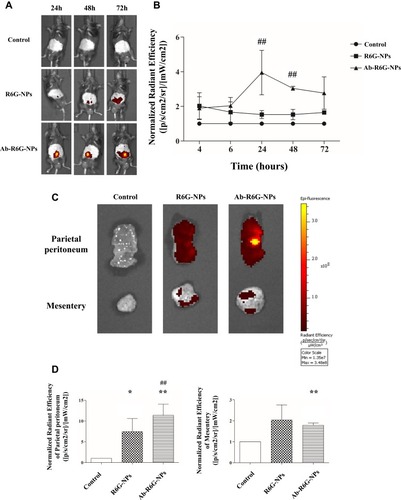
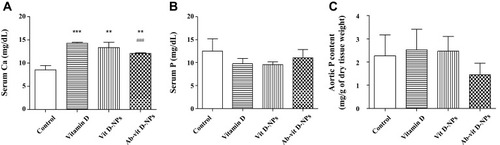
Figure 7 Effect of vit. D-NPs and Ab-vit. D-NPs on serum calcium, phosphate, and aortic phosphate content. C57BL/6 mice received intraperitoneal (i.p.) injection daily of 1α, 25(OH)2D3, vit. D-NPs, and Ab-vit. D-NPs (0.002 μg/g BW of vitamin D3) (n=3 in each group). Mice received daily i.p. instillation of phosphate-buffered saline (PBS) in the control group. Blood samples and aorta tissue samples were taken after 21 days. (A) In the Ab-vit. D-NPs group, the hypercalcemia side effect was significantly lower than the vitamin D group. (B) No significant difference was found in the serum phosphate of the different groups. (C) The aortic phosphorus content showed a trend, though no significant difference of Ab-vit. D-NPs alleviating aortic phosphate deposition. (Data are represented as mean ± SD, n=3; **P<0.01, ***P<0.001, compared with the control group; ###P<0.001, compared with the vitamin D group).