Figures & data

Figure 1 Schematic illustration of drug-eluting hydrophilic coating-modified IOL fabricated via layer-by-layer deposition of heparin and drug-loaded chitosan nanoparticles.
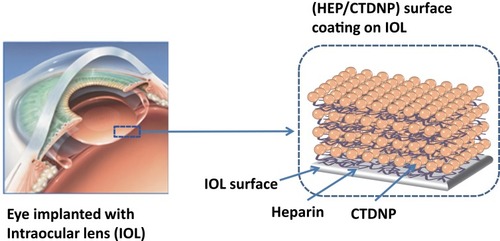
Figure 2 (A) Chitosan particle sizes and zeta potentials change with N/P ratios. (B) Chitosan nanoparticle morphology observed by SEM.
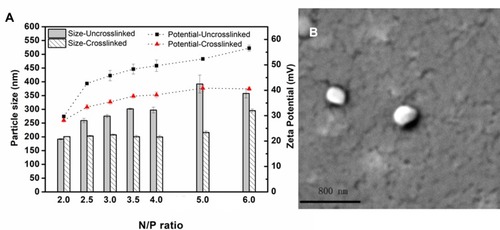
Figure 3 QCM-D shows the HEP/CTDNP multilayer deposition process on the surface. The arrows indicate the injection of different polyelectrolytes.
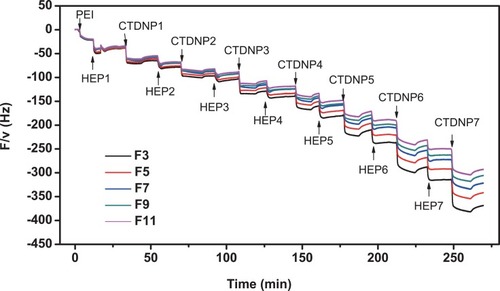
Figure 4 The stereomicroscopic images of the unmodified IOL (A) and the IOL after (HEP/CTDNP)5 coating modification (B).
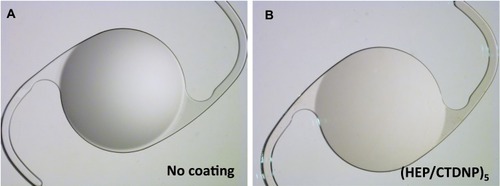
Figure 5 (A) Accumulative drug releases from the drug-eluting IOL with and without cross-linking under different pH conditions. Black square and indigo circle refer to the drug releasing from the cross-linked and uncross-linked coatings under pH 7.4, respectively. Blue triangle and red invert triangle refer to the drug releasing from the cross-linked and uncross-linked coatings under pH 5.5, respectively. (B) Amplified image of the releasing profiles under pH 5.5.
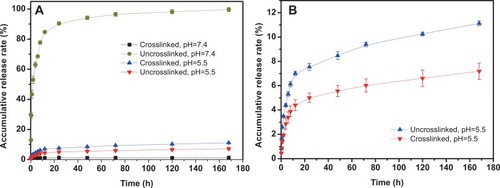
Figure 6 (A) Cell adhesion ratios on the material surface with different bilayer multilayer modifications. (B) Cell apoptosis ratios on the material surface with different bilayer multilayer modifications.*P<0.05, ns means no statistical significance.
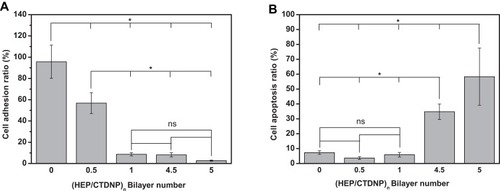
Figure 7 (A) Cell distributions and morphologies on the material surface with different bilayer multilayer modifications. (B) Cell distributions on the material surface with different bilayer multilayer modifications with drug loading ((HEP/CTDNP)n) or without drug loading ((HEP/CTNP)n). Scale bar=200 μm.
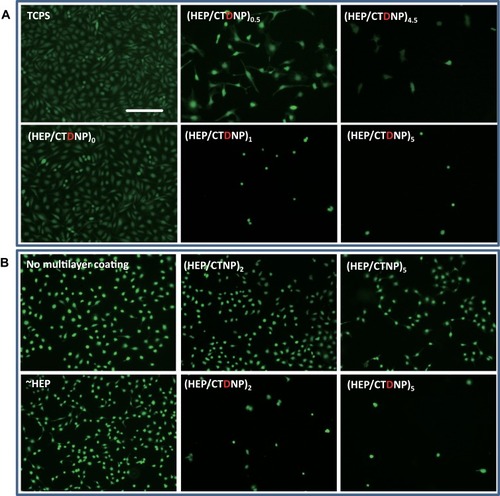
Figure 8 Cell migration assays via cells seeding under different conditions. Images A1–D1 are the stitched images of the 24-well cell culture plates. Images A2–D2 are the representative photos taken from the peripheral area and images A3– D3 are the representative photos taken from the central area. Scale bar=200 μm.
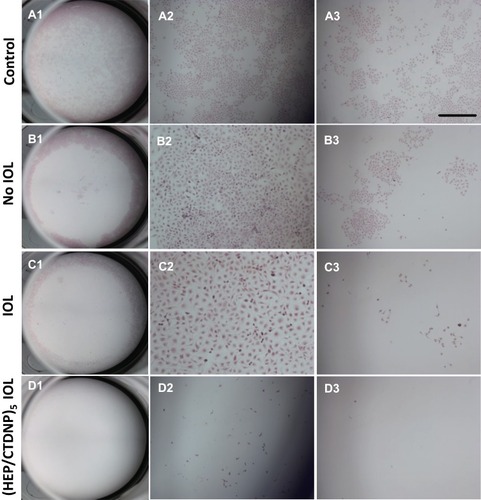
Figure 9 Slit lamp micrographs of IOL with (A) or without (B) (HEP/CTDNP)5 multilayer modification in rabbit eye. Images A1/B1 to A4/B4 are obtained at postoperative 1 day, 1 week, 2 weeks and 2 months postoperatively. The white arrows indicate the PCO.
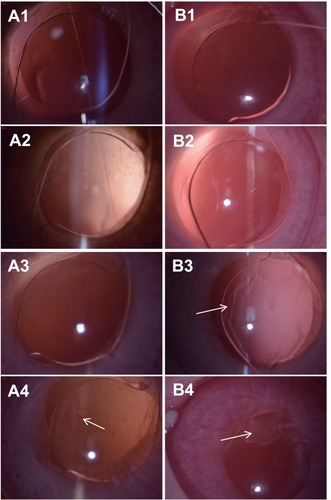
Figure 10 Gross photographs from the posterior (Miyake-Apple view) of rabbit eyes implanted with drug-eluting IOL (A1) or pristine IOL (B1). The anterior view of the separated lens capsules with drug-eluting IOL (A2) or pristine IOL (B2). The red dotted circles indicate the circular outer periphery of the IOL.
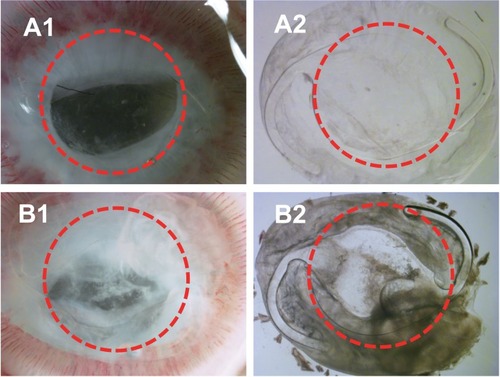
Figure 11 Photographs of histological sections cut from lens capsular bag with drug-eluting IOL (A1) and pristine IOL (B1) implantation. A2 and B2 images are the amplification of the A1 and B2 of the posterior capsule.
Abbreviations: SR, Soemmering’s ring; AC, anterior capsule; PC, posterior capsule.
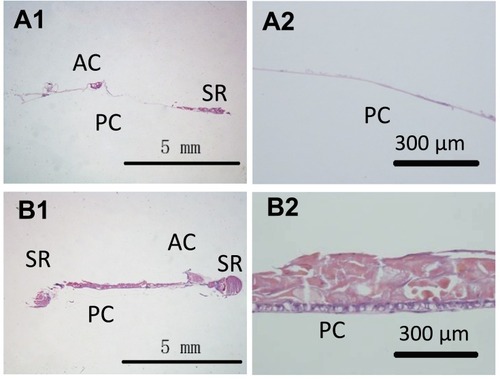
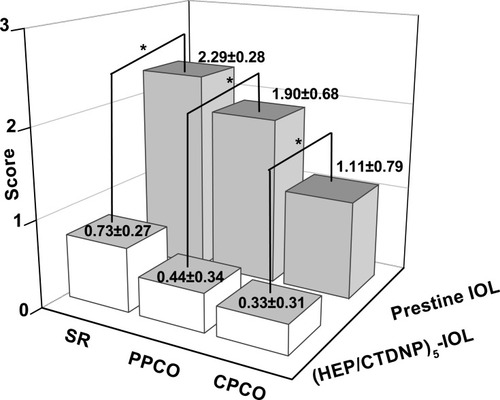
Figure 12 Soemmering’s ring (SR), peripheral PCO (PPCO) and central PCO (CPCO) scores of drug-eluting IOL ((HEP/CTDNP)5 multilayer modified) and control pristine IOL (*P<0.05).