Figures & data
Figure 1 Chemical structure of (A) 20(S)-protopanaxadiol (PPD), an aglycone form of ginsenosides and (B) Compound K.
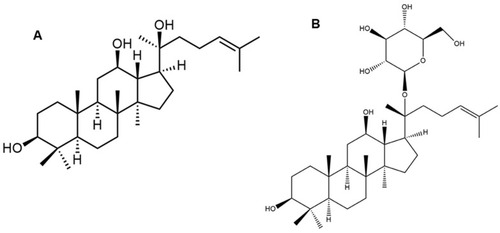
Table 1 Solubility Of PPD In Various Liquid Lipids And Surfactants
Table 2 Independent And Dependent Variables And Their Levels In Box-Behnken Design
Table 3 Box-Behnken Design Matrix With Transformed Values And The Measured Response
Table 4 Results Of Regression Analysis
Figure 2 2D contour plots and 3D response surface plots for the effect of PPD amount, volume of oil, and surfactant amount on (A) particle size, (B) polydispersity index (PDI), and (C) entrapment efficiency (EE).
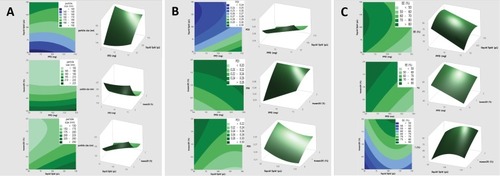
Table 5 Comparison Between The Predicted Yi Values Obtained By BBD And Their Actual Measurement Values Of The Optimized PPD-Loaded NLC Formulation
Figure 3 Optimization plots of Y1, Y2 and Y3 versus X1, X2 and X3.
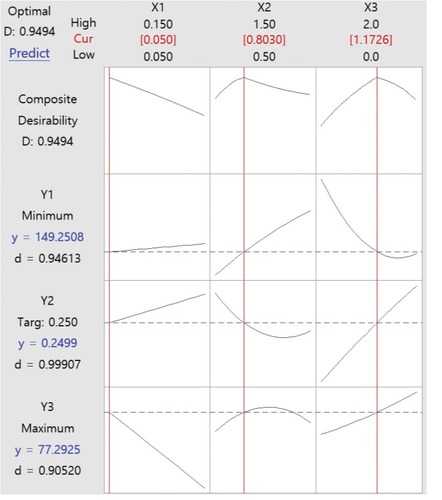
Figure 4 TEM image of NLC optimized by Box-Behnken design. The scale bars represent 200 nm.
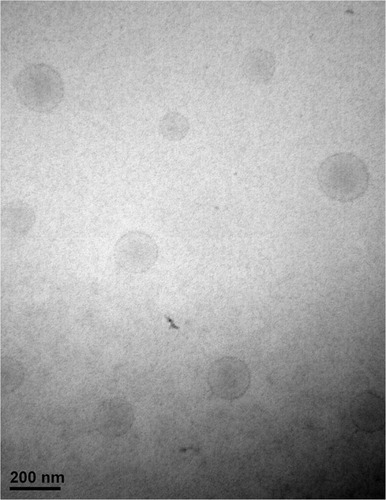
Figure 5 X-ray diffraction patterns of PPD, cetyl palmitate, poloxamer and physical mixture of PPD/cetyl palmitate/poloxamer, freeze-dried NLC without PPD, and freeze-dried NLC with PPD.
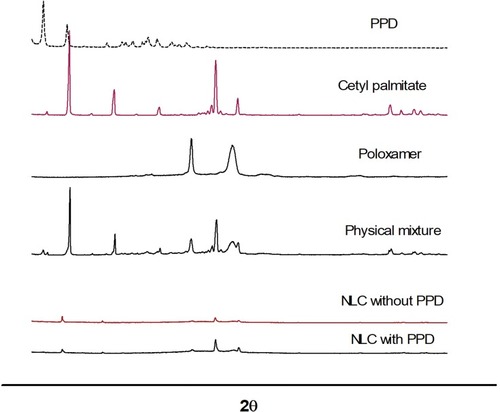
Figure 6 In vitro deposition amount of PPD in the Strat-M™ membrane at 3 hr and 6 hr after application of 1.0 mL of aqueous solution, lipid solution or optimized NLC formulation containing 0.5% (w/v) of PPD. Data were expressed as the mean ± standard deviation (n = 4). ***p < 0.0001.
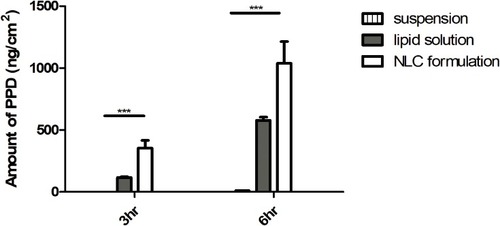
Figure 7 In vitro deposition amount of PPD in the epidermis (A), dermis (B), and total skin (C) of the human cadaver skin at 3 hr and 6 hr after application of 1.0 mL of liquid solution or optimized NLC formulation containing 0.5% (w/v) of PPD. Data were expressed as the mean ± standard deviation (n = 3). *p < 0.05; **p < 0.01; ***p < 0.001.
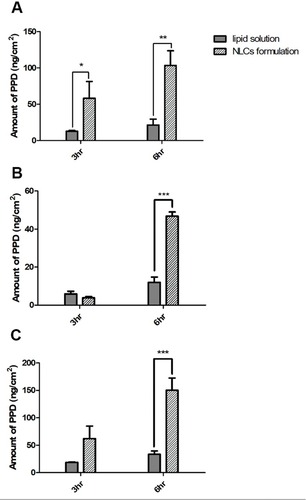
Table 6 Average Irritation Score Of All Human Subjects (n=32) After Single Dose Application Of The Optimized NLC Formulations With Or Without PPD
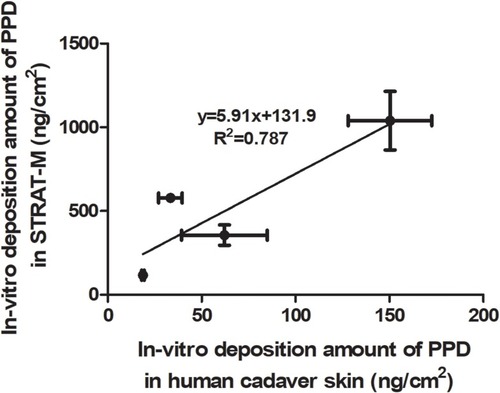
Figure 8 Correlation of the in vitro deposition amount of PPD in the Strat-M™ membrane and the human cadaver skin at 3 hr and 6 hr after application of 1.0 mL of liquid solution or optimized NLC formulation containing 0.5% (w/v) of PPD. Data were expressed as the mean ± standard deviation (n = 3). The solid line represents the fitted regression curve.