Figures & data
Figure 1 (A) The synthetic scheme of PDA-FA-Pc nanomedicine. (B) The illustration of the anticancer mechanism of PDA-FA-Pc nanomedicine: After intravenous injection, PDA-FA-Pc nanomedicine crosses the vascular wall and accumulates in tumor tissues via EPR effects and targeting the FRs on tumor cell surfaces. In the relative acidic tumor microenvironment or lysosomes after internalization, PDA-FA-Pc nanomedicine disintegrates and releases monomeric Pc molecules, which exhibit photodynamic effects to eradicate tumor cells.
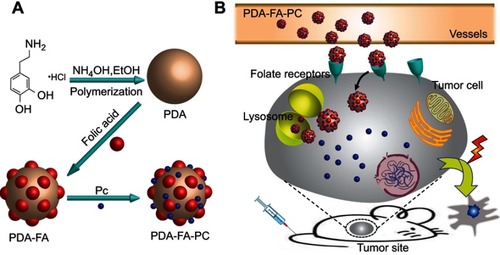
Figure 2 Characterization of PDA-FA-Pc nanomedicine. (A) The scanning electron microscopy image of PDA-FA-Pc nanomedicine. (B) The size distributions of PDA, PDA-FA and PDA-FA-Pc nanomedicine in water measured by DLS. (C) Zeta potentials of PDA, PDA-FA and PDA-FA-Pc nanomedicine. (D) UV-vis absorption spectra of PDA, PDA-FA and PDA-FA-Pc nanomedicine. The UV-vis absorption spectra of pure FA and Pc were shown in Figure S3. (E) The degree of loading (DOL) of FA and Pc in PDA-FA-Pc nanomedicine (w/w %). (F) The release of the monomeric Pc molecules from PDA-FA-Pc nanomedicine in acidic (pH 5) and neutralized (pH 7) conditions. The values were represented as mean ± SD, ***p <0.001.
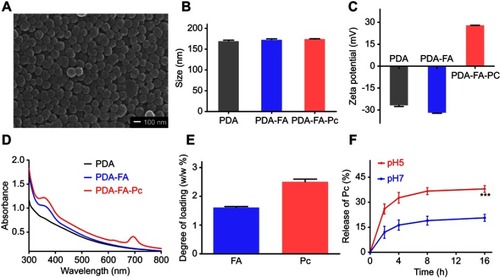
Figure 3 Cellular uptakes of PDA-FA-Pc nanomedicine in FRs overexpressed tumor cell lines (Hela, MCF-7) and healthy cell lines (HELF, L02) by fluorescence analysis (A) and flow cytometric analysis (B).
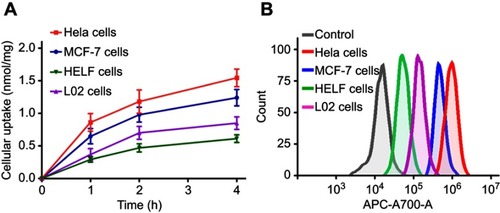
Figure 4 Subcellular imaging of PDA-FA-Pc nanomedicine in tumor cell lines (Hela and MCF-7) and healthy cell lines (HELF and L02). The fluorescent signals of DAPI (a dye for nuclei) and Pc were represented in blue and red, respectively. Scale bars represent 20 µm.
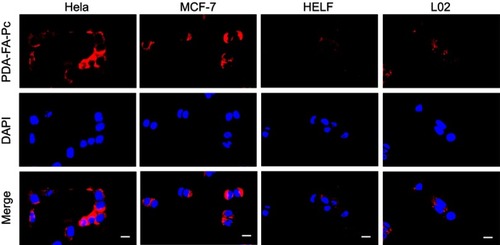
Figure 5 . Anticancer effects of PDA-FA-Pc nanomedicine in vitro. The survival rates of Hela (A), MCF-7 (B), HELF (C) and L02 cells (D) were determined after incubation with PDA-FA-Pc nanomedicineat various concentrations with and without illumination. (E) Phototoxicity of sole FA to Hela cells; (F) Time course for phototoxicities of PDA-FA-Pc nanomedicine (0.6 mg/mL) to Hela cells with and without competition with excessive FA (0.4 µg/mL). Phototoxicities were determined with the illumination at 680 nm with the light dose of 5 J/cm2. The values were represented as mean ± SEM, *p<0.05, ***p<0.001 vs the vehicle (non-treated) group.
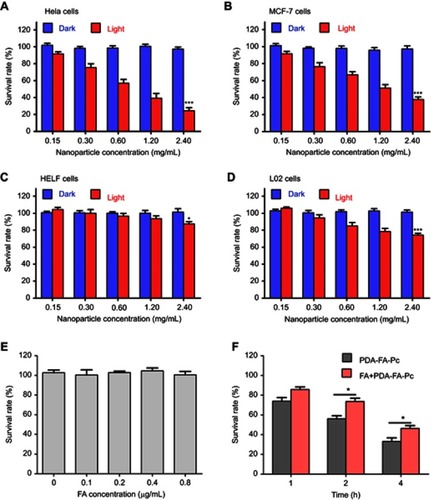
Figure 6 In vivo imaging of PDA-FA-Pc nanomedicine by fluorescent molecular tomography (FMT) imaging of Pc fluorescence in MCF-7 tumor-bearing mice. (A) Imaging graphics of PDA-FA-Pc at the tumor site (T, right) and non-tumor site (NT, left) at 3, 6, 12, 24, 48, and 96 h after intravenious injection. (B) Quantitations of Pc relative concentrations at the non-tumor (NT) and tumor sites (T) at different time points in panel a. (C) The non-tumor (NT) and tumor sites (T) of the saline treated mice showed non-measurable Pc fluorescence signal. The values were represented as mean ± SEM, ***p<0.001, **p<0.01, *p<0.05 vs the fluorescence signals at the NT site.
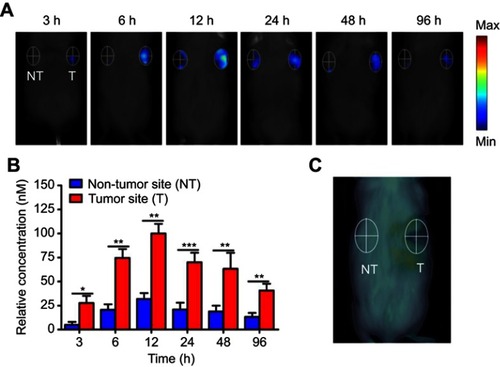
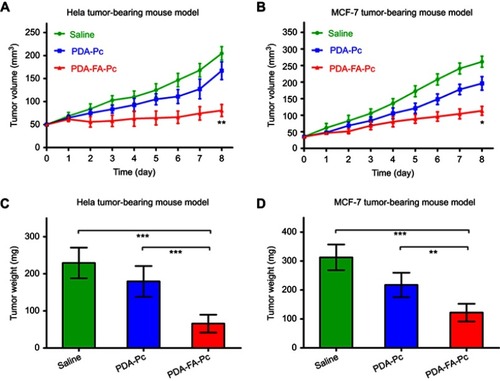
Figure 7 . In vivo antitumor efficacies of PDA-FA-Pc nanomedicine in tumor-bearing mice. (A,B) The tumor volumes in Hela tumor-bearing mice (A) and MCF-7 tumor-bearing mice (B) were daily monitored after illumination on Day 0. (C,D) The weights of tumors resected from Hela tumor-bearing mice (C) and MCF-7 tumor-bearing mice (D) on Day 8. The values were represented as mean ± SEM, ***p <0.001, **p<0.01, *p <0.05 vs the vehicle (saline-treated) group.